
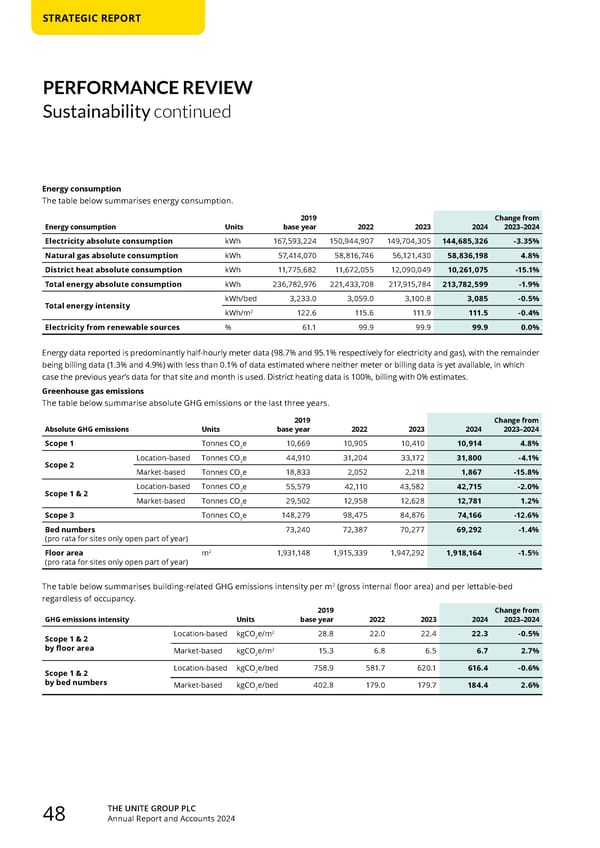
THE UNITE GROUP PLC Annual Report and Accounts 2024 48 STRATEGIC REPORT PERFORMANCE REVIEW Sustainability continued Energy consumption The table below summarises energy consumption. Energy consumption Units 2019 base year 2022 2023 2024 Change from 2023–2024 Electricity absolute consumption kWh 167,593,224 150,944,907 149,704,305 144,685,326 -3.35% Natural gas absolute consumption kWh 57,414,070 58,816,746 56,121,430 58,836,198 4.8% District heat absolute consumption kWh 11,775,682 11,672,055 12,090,049 10,261,075 -15.1% Total energy absolute consumption kWh 236,782,976 221,433,708 217,915,784 213,782,599 -1.9% Total energy intensity kWh/bed 3,233.0 3,059.0 3,100.8 3,085 -0.5% kWh/m2 122.6 115.6 111.9 111.5 -0.4% Electricity from renewable sources % 61.1 99.9 99.9 99.9 0.0% Energy data reported is predominantly half-hourly meter data (98.7% and 95.1% respectively for electricity and gas), with the remainder being billing data (1.3% and 4.9%) with less than 0.1% of data estimated where neither meter or billing data is yet available, in which case the previous year’s data for that site and month is used. District heating data is 100%, billing with 0% estimates. Greenhouse gas emissions The table below summarise absolute GHG emissions or the last three years. Absolute GHG emissions Units 2019 base year 2022 2023 2024 Change from 2023–2024 Scope 1 Tonnes CO2e 10,669 10,905 10,410 10,914 4.8% Scope 2 Location-based Tonnes CO2e 44,910 31,204 33,172 31,800 -4.1% Market-based Tonnes CO2e 18,833 2,052 2,218 1,867 -15.8% Scope 1 & 2 Location-based Tonnes CO2e 55,579 42,110 43,582 42,715 -2.0% Market-based Tonnes CO2e 29,502 12,958 12,628 12,781 1.2% Scope 3 Tonnes CO2e 148,279 98,475 84,876 74,166 -12.6% Bed numbers (pro rata for sites only open part of year) 73,240 72,387 70,277 69,292 -1.4% Floor area (pro rata for sites only open part of year) m2 1,931,148 1,915,339 1,947,292 1,918,164 -1.5% The table below summarises building-related GHG emissions intensity per m2 (gross internal floor area) and per lettable-bed regardless of occupancy. GHG emissions intensity Units 2019 base year 2022 2023 2024 Change from 2023–2024 Scope 1 & 2 by floor area Location-based kgCO2e/m2 28.8 22.0 22.4 22.3 -0.5% Market-based kgCO2e/m2 15.3 6.8 6.5 6.7 2.7% Scope 1 & 2 by bed numbers Location-based kgCO2e/bed 758.9 581.7 620.1 616.4 -0.6% Market-based kgCO2e/bed 402.8 179.0 179.7 184.4 2.6%
 Home for Success: Unite Students Annual Report 2024 Page 49 Page 51