
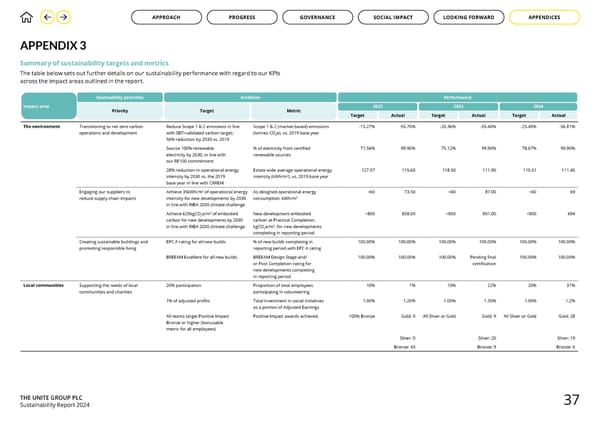
THE UNITE GROUP PLC Sustainability Report 2024 APPENDIX 3 Impact area Sustaiability priorities Ambition Performance Priority Target Metric 2022 2023 2024 Target Actual Target Actual Target Actual The environment Transitioning to net zero carbon operations and development Reduce Scope 1 & 2 emissions in line with SBTi-validated carbon target; 56% reduction by 2030 vs. 2019 Scope 1 & 2 (market-based) emissions (tonnes CO 2 e), vs. 2019 base year -15.27% -55.70% -20.36% -55.40% -25.45% -56.81% Source 100% renewable electricity by 2030, in line with our RE100 commitment % of electricity from certified renewable sources 71.56% 99.90% 75.12% 99.90% 78.67% 99.90% 28% reduction in operational energy intensity by 2030 vs. the 2019 base year in line with CRREM Estate wide average operational energy intensity (kWh/m 2 ), vs. 2019 base year 127.07 115.60 118.50 111.90 110.51 111.45 Engaging our suppliers to reduce supply chain impacts Achieve 35kWh/m 2 of operational energy intensity for new developments by 2030 in line with RIBA 2030 climate challenge As designed operational energy consumption, kWh/m 2 <60 73.50 <60 87.00 <60 69 Achieve 625kgCO 2 e/m 2 of embodied carbon for new developments by 2030 in line with RIBA 2030 climate challenge New development embodied carbon at Practical Completion, kgCO 2 e/m 2 , for new developments completing in reporting period <800 858.00 <800 801.00 <800 694 Creating sustainable buildings and promoting responsible living EPC A rating for all new builds % of new builds completing in reporting period with EPC A rating 100.00% 100.00% 100.00% 100.00% 100.00% 100.00% BREEAM Excellent for all new builds BREEAM Design Stage and/ or Post Completion rating for new developments completing in reporting period 100.00% 100.00% 100.00% Pending final certification 100.00% 100.00% Local communities Supporting the needs of local communities and charities 20% participation Proportion of total employees participating in volunteering 10% 1% 10% 22% 20% 31% 1% of adjusted profits Total investment in social initiatives as a portion of Adjusted Earnings 1.00% 1.20% 1.00% 1.30% 1.00% 1.2% All teams target Positive Impact Bronze or higher (bonusable metric for all employees) Positive Impact awards achieved 100% Bronze Gold: 0 All Sliver or Gold Gold: 9 All Sliver or Gold Gold: 28 Silver: 0 Silver: 20 Silver: 19 Bronze: 43 Bronze: 9 Bronze: 0 Summary of sustainability targets and metrics The table below sets out further details on our sustainability performance with regard to our KPIs across the impact areas outlined in the report. 37 GOVERNANCE APPROACH PROGRESS SOCIAL IMPACT LOOKING FORWARD APPENDICES
 Making a Positive Impact: Sustainability Report 2024 Page 37 Page 39