
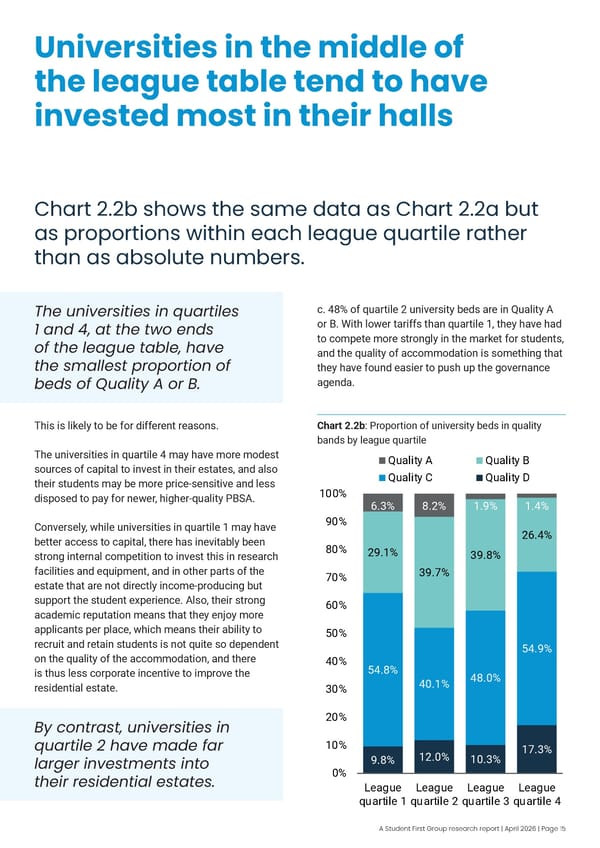
Universities in the middle of the league table tend to have invested most in their halls Chart 2.2b shows the same data as Chart 2.2a but as proportions within each league quartile rather than as absolute numbers. The universities in quartiles 1 and 4, at the two ends of the league table, have the smallest proportion of beds of Quality A or B. This is likely to be for different reasons. The universities in quartile 4 may have more modest sources of capital to invest in their estates, and also their students may be more price-sensitive and less disposed to pay for newer, higher-quality PBSA. Conversely, while universities in quartile 1 may have better access to capital, there has inevitably been strong internal competition to invest this in research facilities and equipment, and in other parts of the estate that are not directly income-producing but support the student experience. Also, their strong academic reputation means that they enjoy more applicants per place, which means their ability to recruit and retain students is not quite so dependent on the quality of the accommodation, and there is thus less corporate incentive to improve the residential estate. By contrast, universities in quartile 2 have made far larger investments into their residential estates. c. 48% of quartile 2 university beds are in Quality A or B. With lower tariffs than quartile 1, they have had to compete more strongly in the market for students, and the quality of accommodation is something that they have found easier to push up the governance agenda. Chart 2.2b : Proportion of university beds in quality bands by league quartile 9.8% 12.0% 10.3% 17.3% 54.8% 40.1% 48.0% 54.9% 29.1% 39.7% 39.8% 26.4% 6.3% 8.2% 1.9% 1.4% 0% 10% 20% 30% 40% 50% 60% 70% 80% 90% 100% League quartile 1 League quartile 2 League quartile 3 League quartile 4 Quality A Quality B Quality C Quality D A Student First Group research report | April 2026 | Page 15
 Meeting demand for modernised university accommodation Page 16 Page 18