
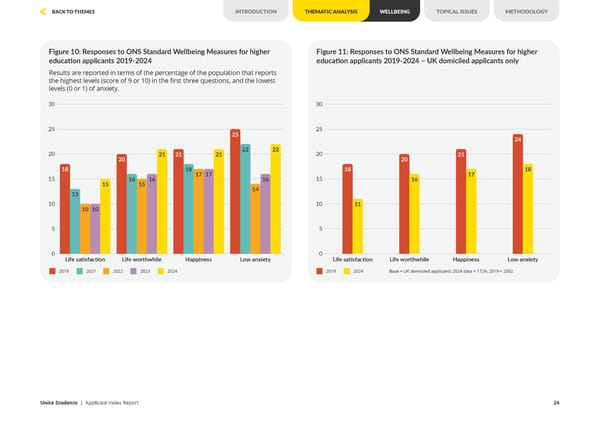
Figure 10: Responses to ONS Standard Wellbeing Measures for higher education applicants 2019-2024 Results are reported in terms of the percentage of the population that reports the highest levels (score of 9 or 10) in the first three questions, and the lowest levels (0 or 1) of anxiety. Figure 11: Responses to ONS Standard Wellbeing Measures for higher education applicants 2019-2024 – UK domiciled applicants only Life satisfaction 30 25 20 15 10 5 0 18 13 10 10 15 Life worthwhile 20 16 15 16 21 Happiness 21 18 17 17 21 Low anxiety 25 22 14 16 22 Life satisfaction 30 25 20 15 10 5 0 18 11 20 16 21 17 24 18 Life worthwhile Happiness Low anxiety 2019 2021 2022 2023 2024 2019 2024 Base = UK domiciled applicants 2024 data = 1724; 2019 = 2002 Unite Students | Applicant Index Report 24 INTRODUCTION THEMATIC ANALYSIS WELLBEING METHODOLOGY TOPICAL ISSUES BACK TO THEMES
 Unite Applicant Index Report 2024 Page 23 Page 25