
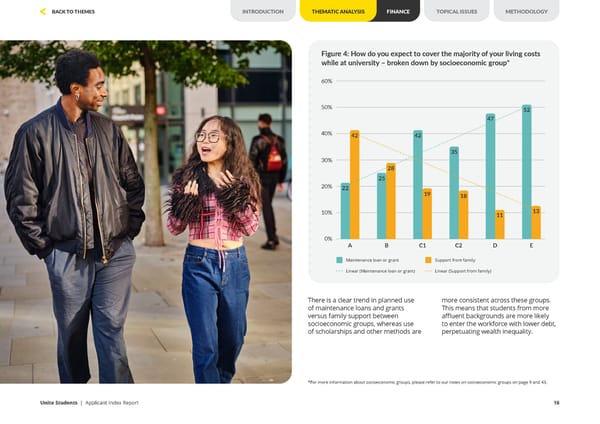
There is a clear trend in planned use of maintenance loans and grants versus family support between socioeconomic groups, whereas use of scholarships and other methods are more consistent across these groups. This means that students from more affluent backgrounds are more likely to enter the workforce with lower debt, perpetuating wealth inequality. Figure 4: How do you expect to cover the majority of your living costs while at university – broken down by socioeconomic group* 60% 50% 40% 30% 20% 10% 0% A B C1 C2 D E Maintenance loan or grant Linear (Maintenance loan or grant) Linear (Support from family) Support from family *For more information about socioeconomic groups, please refer to our notes on socioeconomic groups on page 9 and 43. 52 47 42 42 28 25 22 19 18 11 13 35 Unite Students | Applicant Index Report 16 INTRODUCTION THEMATIC ANALYSIS FINANCE METHODOLOGY TOPICAL ISSUES BACK TO THEMES
 Unite Applicant Index Report 2024 Page 15 Page 17