
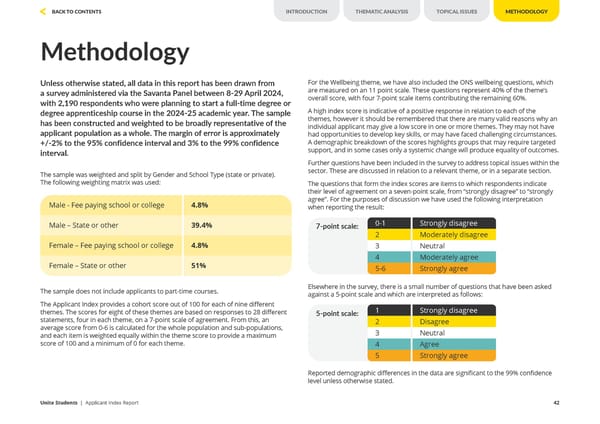
Methodology Unless otherwise stated, all data in this report has been drawn from a survey administered via the Savanta Panel between 8-29 April 2024, with 2,190 respondents who were planning to start a full-time degree or degree apprenticeship course in the 2024-25 academic year. The sample has been constructed and weighted to be broadly representative of the applicant population as a whole. The margin of error is approximately +/-2% to the 95% confidence interval and 3% to the 99% confidence interval. The sample does not include applicants to part-time courses. The Applicant Index provides a cohort score out of 100 for each of nine different themes. The scores for eight of these themes are based on responses to 28 different statements, four in each theme, on a 7-point scale of agreement. From this, an average score from 0-6 is calculated for the whole population and sub-populations, and each item is weighted equally within the theme score to provide a maximum score of 100 and a minimum of 0 for each theme. The sample was weighted and split by Gender and School Type (state or private). The following weighting matrix was used: For the Wellbeing theme, we have also included the ONS wellbeing questions, which are measured on an 11 point scale. These questions represent 40% of the theme’s overall score, with four 7-point scale items contributing the remaining 60%. A high index score is indicative of a positive response in relation to each of the themes, however it should be remembered that there are many valid reasons why an individual applicant may give a low score in one or more themes. They may not have had opportunities to develop key skills, or may have faced challenging circumstances. A demographic breakdown of the scores highlights groups that may require targeted support, and in some cases only a systemic change will produce equality of outcomes. Further questions have been included in the survey to address topical issues within the sector. These are discussed in relation to a relevant theme, or in a separate section. The questions that form the index scores are items to which respondents indicate their level of agreement on a seven-point scale, from “strongly disagree” to “strongly agree”. For the purposes of discussion we have used the following interpretation when reporting the result: Elsewhere in the survey, there is a small number of questions that have been asked against a 5-point scale and which are interpreted as follows: Reported demographic differences in the data are significant to the 99% confidence level unless otherwise stated. 7-point scale: Strongly disagree 0-1 Moderately disagree 2 Neutral 3 Moderately agree 4 Strongly agree 5-6 5-point scale: Strongly disagree 1 Disagree 2 Neutral 3 Agree 4 Strongly agree 5 Male - Fee paying school or college 4.8% Male – State or other 39.4% Female – Fee paying school or college 4.8% Female – State or other 51% Unite Students | Applicant Index Report 42 INTRODUCTION THEMATIC ANALYSIS BACK TO CONTENTS METHODOLOGY TOPICAL ISSUES
 Unite Applicant Index Report 2024 Page 41 Page 43