
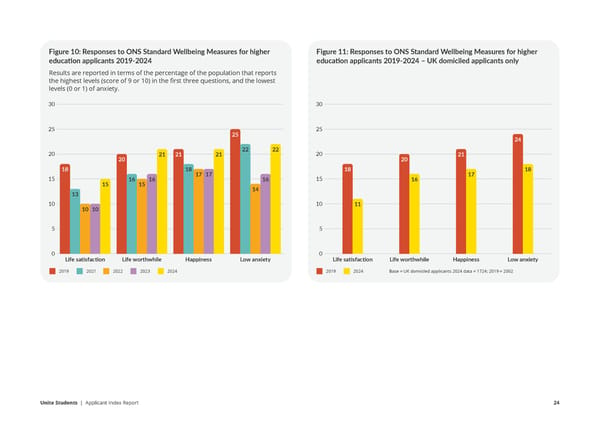
Figure 10: Responses to ONS Standard Wellbeing Measures for higher Figure 11: Responses to ONS Standard Wellbeing Measures for higher educa琀椀on applicants 2019-2024 educa琀椀on applicants 2019-2024 – UK domiciled applicants only Results are reported in terms of the percentage of the population that reports the highest levels (score of 9 or 10) in the first three questions, and the lowest levels (0 or 1) of anxiety. 30 30 25 25 25 24 20 21 21 21 22 22 20 21 20 20 18 18 17 17 18 17 18 15 15 16 15 16 16 15 16 13 14 10 10 10 10 11 5 5 0 Life satisfaction Life worthwhile Happiness Low anxiety 0 Life satisfaction Life worthwhile Happiness Low anxiety 2019 2021 2022 2023 2024 2019 2024 Base = UK domiciled applicants 2024 data = 1724; 2019 = 2002 Unite Students | Applicant Index Report 24
 Unite Applicant Index Report Page 23 Page 25