
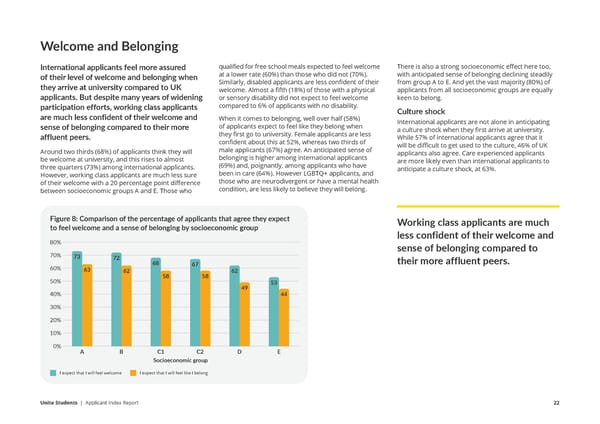
Welcome and Belonging International applicants feel more assured qualified for free school meals expected to feel welcome There is also a strong socioeconomic effect here too, of their level of welcome and belonging when at a lower rate (60%) than those who did not (70%). with anticipated sense of belonging declining steadily they arrive at university compared to UK Similarly, disabled applicants are less confident of their from group A to E. And yet the vast majority (80%) of welcome. Almost a fifth (18%) of those with a physical applicants from all socioeconomic groups are equally applicants. But despite many years of widening or sensory disability did not expect to feel welcome keen to belong. participation efforts, working class applicants compared to 6% of applicants with no disability. Culture shock are much less confident of their welcome and When it comes to belonging, well over half (58%) International applicants are not alone in anticipating sense of belonging compared to their more of applicants expect to feel like they belong when a culture shock when they first arrive at university. affluent peers. they first go to university. Female applicants are less While 57% of international applicants agree that it confident about this at 52%, whereas two thirds of will be difficult to get used to the culture, 46% of UK Around two thirds (68%) of applicants think they will male applicants (67%) agree. An anticipated sense of applicants also agree. Care experienced applicants be welcome at university, and this rises to almost belonging is higher among international applicants are more likely even than international applicants to three quarters (73%) among international applicants. (69%) and, poignantly, among applicants who have anticipate a culture shock, at 63%. However, working class applicants are much less sure been in care (64%). However LGBTQ+ applicants, and of their welcome with a 20 percentage point difference those who are neurodivergent or have a mental health between socioeconomic groups A and E. Those who condition, are less likely to believe they will belong. Figure 8: Comparison of the percentage of applicants that agree they expect Working class applicants are much to feel welcome and a sense of belonging by socioeconomic group less confident of their welcome and 80% sense of belonging compared to 70% 73 72 their more affluent peers. 60% 68 67 63 62 62 50% 58 58 49 53 40% 44 30% 20% 10% 0% A B C1 C2 D E Socioeconomic group I expect that I will feel welcome I expect that I will feel like I belong Unite Students | Applicant Index Report 22
 Unite Applicant Index Report Page 21 Page 23