
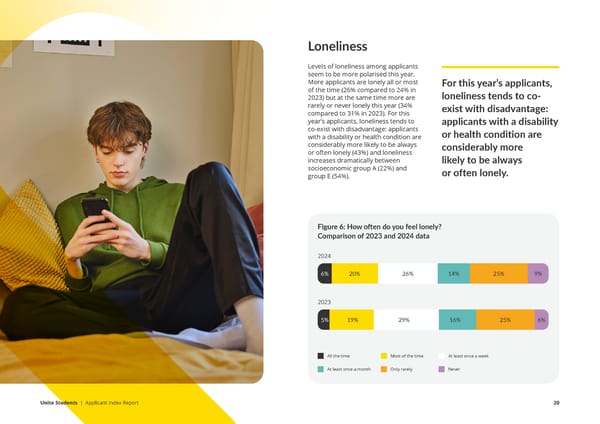
Loneliness Levels of loneliness among applicants seem to be more polarised this year. More applicants are lonely all or most For this year’s applicants, of the time (26% compared to 24% in loneliness tends to co- 2023) but at the same time more are rarely or never lonely this year (34% exist with disadvantage: compared to 31% in 2023). For this year’s applicants, loneliness tends to applicants with a disability co-exist with disadvantage: applicants or health condition are with a disability or health condition are considerably more likely to be always considerably more or often lonely (43%) and loneliness increases dramatically between likely to be always socioeconomic group A (22%) and or often lonely. group E (54%). Figure 6: How o昀琀en do you feel lonely? Comparison of 2023 and 2024 data 2024 6% 20% 26% 14% 25% 9% 2023 5% 19% 29% 16% 25% 6% All the time Most of the time At least once a week At least once a month Only rarely Never Unite Students | Applicant Index Report 20
 Unite Applicant Index Report Page 19 Page 21