
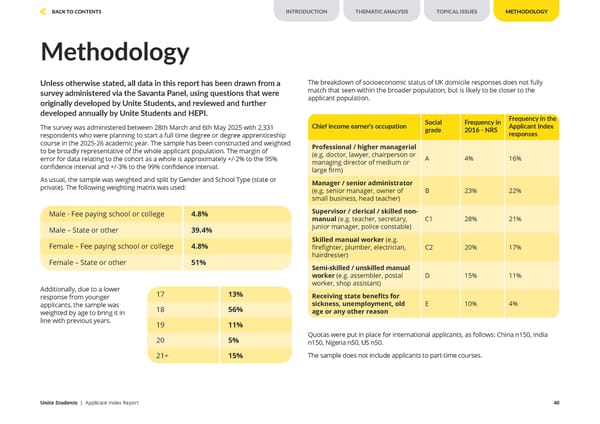
Methodology Unless otherwise stated, all data in this report has been drawn from a survey administered via the Savanta Panel, using questions that were originally developed by Unite Students, and reviewed and further developed annually by Unite Students and HEPI. The survey was administered between 28th March and 6th May 2025 with 2,331 respondents who were planning to start a full time degree or degree apprenticeship course in the 2025-26 academic year. The sample has been constructed and weighted to be broadly representative of the whole applicant population. The margin of error for data relating to the cohort as a whole is approximately +/-2% to the 95% confidence interval and +/-3% to the 99% confidence interval. As usual, the sample was weighted and split by Gender and School Type (state or private). The following weighting matrix was used: Additionally, due to a lower response from younger applicants, the sample was weighted by age to bring it in line with previous years. The breakdown of socioeconomic status of UK domicile responses does not fully match that seen within the broader population, but is likely to be closer to the applicant population. Quotas were put in place for international applicants, as follows: China n150, India n150, Nigeria n50, US n50. The sample does not include applicants to part-time courses. Male - Fee paying school or college 4.8% Male – State or other 39.4% Female – Fee paying school or college 4.8% Female – State or other 51% 17 13% 18 56% 19 11% 20 5% 21+ 15% Chief income earner’s occupation Social grade Frequency in 2016 - NRS Frequency in the Applicant Index responses Professional / higher managerial (e.g. doctor, lawyer, chairperson or managing director of medium or large firm) A 4% 16% Manager / senior administrator (e.g. senior manager, owner of small business, head teacher) B 23% 22% Supervisor / clerical / skilled non- manual (e.g. teacher, secretary, junior manager, police constable) C1 28% 21% Skilled manual worker (e.g. firefighter, plumber, electrician, hairdresser) C2 20% 17% Semi-skilled / unskilled manual worker (e.g. assembler, postal worker, shop assistant) D 15% 11% Receiving state benefits for sickness, unemployment, old age or any other reason E 10% 4% Unite Students | Applicant Index Report 40 INTRODUCTION THEMATIC ANALYSIS BACK TO CONTENTS METHODOLOGY TOPICAL ISSUES
 Unite Students Applicant Index - 2025 Page 39 Page 41