
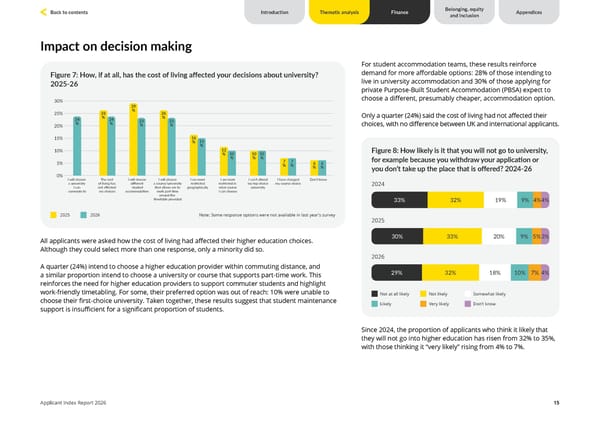
15 Appendices Introduction Finance Thematic analysis Applicant Index Report 2026 Figure 7: How, if at all, has the cost of living affected your decisions about university? 2025-26 2025 2026 0% 5% 10% 15% 20% 25% 30% I will choose a university I can commute to The cost of living has not affected my choices I will choose different student accommodation I will choose a course/university that allows me to work part time around the timetable provided I am more restricted geographically I am more restricted in what course I can choose I can’t attend my top choice university I have changed my course choice Don’t know 24 % 24 % 26 % 29 % 23 % 23 % 26 % 16 % 15 % 12 % 10 % 10 % 10 % 7 % 7 % 6 % 6 % Impact on decision making All applicants were asked how the cost of living had affected their higher education choices. Although they could select more than one response, only a minority did so. A quarter (24%) intend to choose a higher education provider within commuting distance, and a similar proportion intend to choose a university or course that supports part‑time work. This reinforces the need for higher education providers to support commuter students and highlight work‑friendly timetabling. For some, their preferred option was out of reach: 10% were unable to choose their first ‑ choice university. Taken together, these results suggest that student maintenance support is insufficient for a significant proportion of students. For student accommodation teams, these results reinforce demand for more affordable options: 28% of those intending to live in university accommodation and 30% of those applying for private Purpose ‑ Built Student Accommodation (PBSA) expect to choose a different, presumably cheaper, accommodation option. Only a quarter (24%) said the cost of living had not affected their choices, with no difference between UK and international applicants. Figure 8: How likely is it that you will not go to university, for example because you withdraw your application or you don’t take up the place that is offered? 2024-26 2025 2024 2026 Not at all likely Not likely Somewhat likely Likely Very likely Don’t know 33% 32% 19% 9% 4%4% 30% 33% 20% 9% 5% 3% 29% 32% 18% 10% 7% 4% Since 2024, the proportion of applicants who think it likely that they will not go into higher education has risen from 32% to 35%, with those thinking it “very likely” rising from 4% to 7%. Belonging, equity and inclusion Back to contents Note: Some response options were not available in last year’s survey
 Unite Students Applicant Index 2026 Page 14 Page 16