
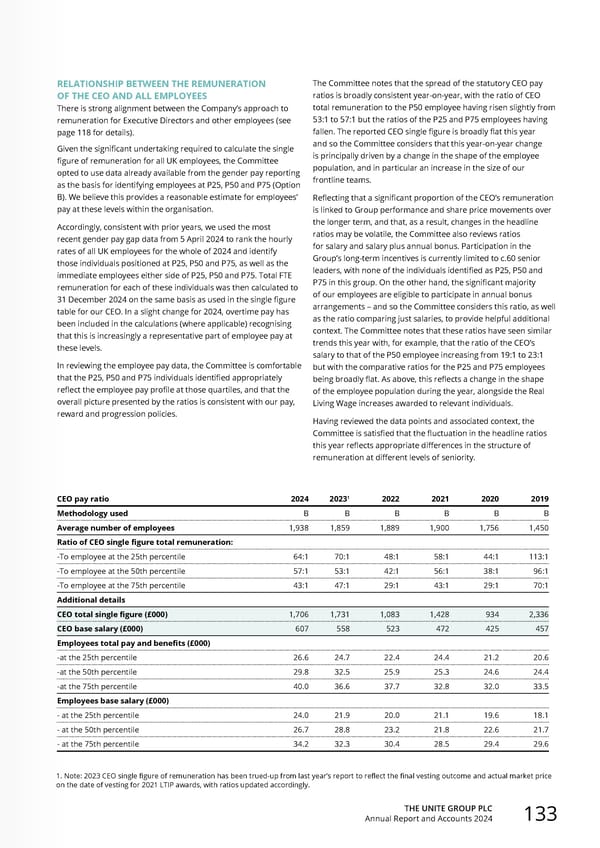
THE UNITE GROUP PLC Annual Report and Accounts 2024 133 RELATIONSHIP BETWEEN THE REMUNERATION OF THE CEO AND ALL EMPLOYEES There is strong alignment between the Company’s approach to remuneration for Executive Directors and other employees (see page 118 for details). Given the significant undertaking required to calculate the single figure of remuneration for all UK employees, the Committee opted to use data already available from the gender pay reporting as the basis for identifying employees at P25, P50 and P75 (Option B). We believe this provides a reasonable estimate for employees’ pay at these levels within the organisation. Accordingly, consistent with prior years, we used the most recent gender pay gap data from 5 April 2024 to rank the hourly rates of all UK employees for the whole of 2024 and identify those individuals positioned at P25, P50 and P75, as well as the immediate employees either side of P25, P50 and P75. Total FTE remuneration for each of these individuals was then calculated to 31 December 2024 on the same basis as used in the single figure table for our CEO. In a slight change for 2024, overtime pay has been included in the calculations (where applicable) recognising that this is increasingly a representative part of employee pay at these levels. In reviewing the employee pay data, the Committee is comfortable that the P25, P50 and P75 individuals identified appropriately reflect the employee pay profile at those quartiles, and that the overall picture presented by the ratios is consistent with our pay, reward and progression policies. CEO pay ratio 2024 20231 2022 2021 2020 2019 Methodology used B B B B B B Average number of employees 1,938 1,859 1,889 1,900 1,756 1,450 Ratio of CEO single figure total remuneration: -To employee at the 25th percentile 64:1 70:1 48:1 58:1 44:1 113:1 -To employee at the 50th percentile 57:1 53:1 42:1 56:1 38:1 96:1 -To employee at the 75th percentile 43:1 47:1 29:1 43:1 29:1 70:1 Additional details CEO total single figure (£000) 1,706 1,731 1,083 1,428 934 2,336 CEO base salary (£000) 607 558 523 472 425 457 Employees total pay and benefits (£000) -at the 25th percentile 26.6 24.7 22.4 24.4 21.2 20.6 -at the 50th percentile 29.8 32.5 25.9 25.3 24.6 24.4 -at the 75th percentile 40.0 36.6 37.7 32.8 32.0 33.5 Employees base salary (£000) - at the 25th percentile 24.0 21.9 20.0 21.1 19.6 18.1 - at the 50th percentile 26.7 28.8 23.2 21.8 22.6 21.7 - at the 75th percentile 34.2 32.3 30.4 28.5 29.4 29.6 1. Note: 2023 CEO single figure of remuneration has been trued-up from last year’s report to reflect the final vesting outcome and actual market price on the date of vesting for 2021 LTIP awards, with ratios updated accordingly. The Committee notes that the spread of the statutory CEO pay ratios is broadly consistent year-on-year, with the ratio of CEO total remuneration to the P50 employee having risen slightly from 53:1 to 57:1 but the ratios of the P25 and P75 employees having fallen. The reported CEO single figure is broadly flat this year and so the Committee considers that this year-on-year change is principally driven by a change in the shape of the employee population, and in particular an increase in the size of our frontline teams. Reflecting that a significant proportion of the CEO’s remuneration is linked to Group performance and share price movements over the longer term, and that, as a result, changes in the headline ratios may be volatile, the Committee also reviews ratios for salary and salary plus annual bonus. Participation in the Group’s long-term incentives is currently limited to c.60 senior leaders, with none of the individuals identified as P25, P50 and P75 in this group. On the other hand, the significant majority of our employees are eligible to participate in annual bonus arrangements – and so the Committee considers this ratio, as well as the ratio comparing just salaries, to provide helpful additional context. The Committee notes that these ratios have seen similar trends this year with, for example, that the ratio of the CEO’s salary to that of the P50 employee increasing from 19:1 to 23:1 but with the comparative ratios for the P25 and P75 employees being broadly flat. As above, this reflects a change in the shape of the employee population during the year, alongside the Real Living Wage increases awarded to relevant individuals. Having reviewed the data points and associated context, the Committee is satisfied that the fluctuation in the headline ratios this year reflects appropriate differences in the structure of remuneration at different levels of seniority.
 Home for Success: Unite Students Annual Report 2024 Page 134 Page 136