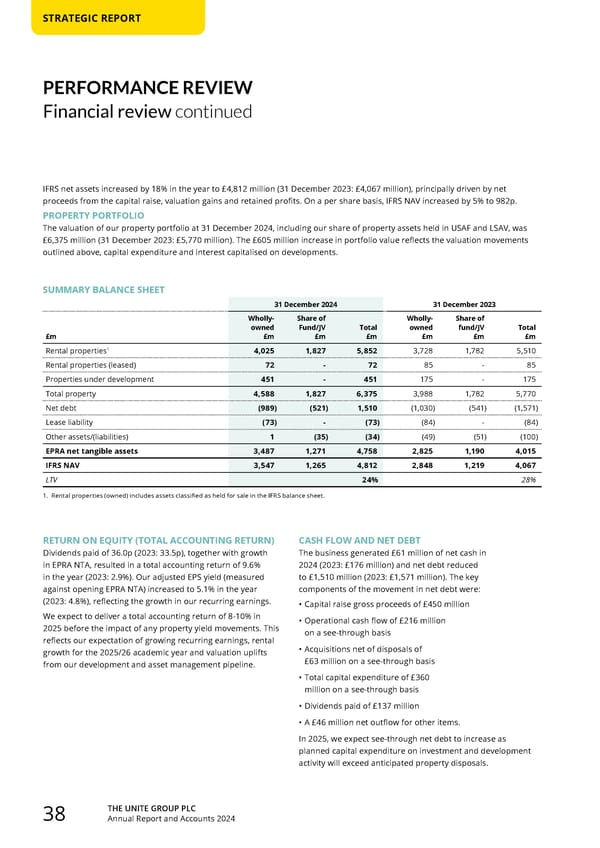
THE UNITE GROUP PLC Annual Report and Accounts 2024 38 STRATEGIC REPORT PERFORMANCE REVIEW Financial review continued IFRS net assets increased by 18% in the year to £4,812 million (31 December 2023: £4,067 million), principally driven by net proceeds from the capital raise, valuation gains and retained profits. On a per share basis, IFRS NAV increased by 5% to 982p. PROPERTY PORTFOLIO The valuation of our property portfolio at 31 December 2024, including our share of property assets held in USAF and LSAV, was £6,375 million (31 December 2023: £5,770 million). The £605 million increase in portfolio value reflects the valuation movements outlined above, capital expenditure and interest capitalised on developments. SUMMARY BALANCE SHEET 31 December 2024 31 December 2023 £m Wholly- owned £m Share of Fund/JV £m Total £m Wholly- owned £m Share of fund/JV £m Total £m Rental properties1 4,025 1,827 5,852 3,728 1,782 5,510 Rental properties (leased) 72 - 72 85 - 85 Properties under development 451 - 451 175 - 175 Total property 4,588 1,827 6,375 3,988 1,782 5,770 Net debt (989) (521) 1,510 (1,030) (541) (1,571) Lease liability (73) - (73) (84) - (84) Other assets/(liabilities) 1 (35) (34) (49) (51) (100) EPRA net tangible assets 3,487 1,271 4,758 2,825 1,190 4,015 IFRS NAV 3,547 1,265 4,812 2,848 1,219 4,067 LTV 24% 28% 1. Rental properties (owned) includes assets classified as held for sale in the IFRS balance sheet. RETURN ON EQUITY (TOTAL ACCOUNTING RETURN) Dividends paid of 36.0p (2023: 33.5p), together with growth in EPRA NTA, resulted in a total accounting return of 9.6% in the year (2023: 2.9%). Our adjusted EPS yield (measured against opening EPRA NTA) increased to 5.1% in the year (2023: 4.8%), reflecting the growth in our recurring earnings. We expect to deliver a total accounting return of 8-10% in 2025 before the impact of any property yield movements. This reflects our expectation of growing recurring earnings, rental growth for the 2025/26 academic year and valuation uplifts from our development and asset management pipeline. CASH FLOW AND NET DEBT The business generated £61 million of net cash in 2024 (2023: £176 million) and net debt reduced to £1,510 million (2023: £1,571 million). The key components of the movement in net debt were: • Capital raise gross proceeds of £450 million • Operational cash flow of £216 million on a see-through basis • Acquisitions net of disposals of £63 million on a see-through basis • Total capital expenditure of £360 million on a see-through basis • Dividends paid of £137 million • A £46 million net outflow for other items. In 2025, we expect see-through net debt to increase as planned capital expenditure on investment and development activity will exceed anticipated property disposals.
 Home for Success: Unite Students Annual Report 2024 Page 39 Page 41