
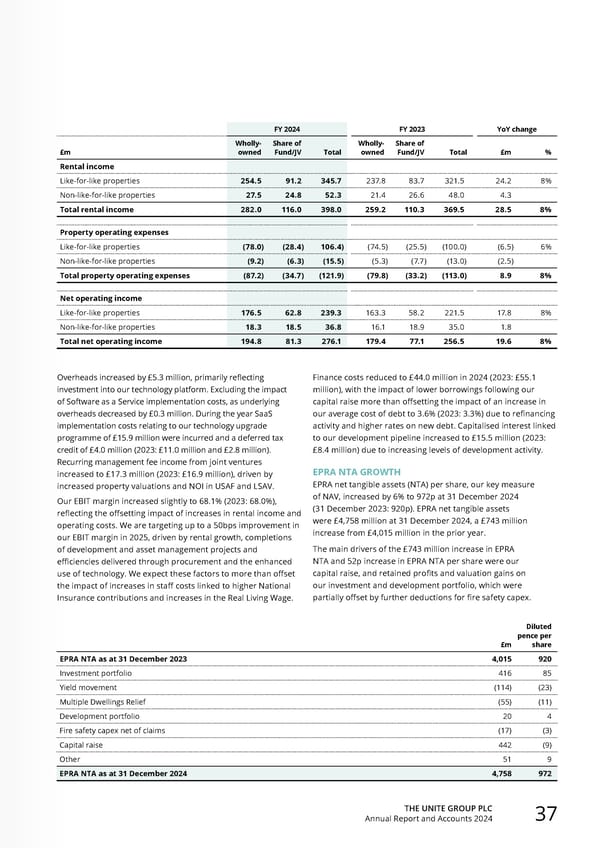
THE UNITE GROUP PLC Annual Report and Accounts 2024 37 FY 2024 FY 2023 YoY change £m Wholly- owned Share of Fund/JV Total Wholly- owned Share of Fund/JV Total £m % Rental income Like-for-like properties 254.5 91.2 345.7 237.8 83.7 321.5 24.2 8% Non-like-for-like properties 27.5 24.8 52.3 21.4 26.6 48.0 4.3 Total rental income 282.0 116.0 398.0 259.2 110.3 369.5 28.5 8% Property operating expenses Like-for-like properties (78.0) (28.4) 106.4) (74.5) (25.5) (100.0) (6.5) 6% Non-like-for-like properties (9.2) (6.3) (15.5) (5.3) (7.7) (13.0) (2.5) Total property operating expenses (87.2) (34.7) (121.9) (79.8) (33.2) (113.0) 8.9 8% Net operating income Like-for-like properties 176.5 62.8 239.3 163.3 58.2 221.5 17.8 8% Non-like-for-like properties 18.3 18.5 36.8 16.1 18.9 35.0 1.8 Total net operating income 194.8 81.3 276.1 179.4 77.1 256.5 19.6 8% Overheads increased by £5.3 million, primarily reflecting investment into our technology platform. Excluding the impact of Software as a Service implementation costs, as underlying overheads decreased by £0.3 million. During the year SaaS implementation costs relating to our technology upgrade programme of £15.9 million were incurred and a deferred tax credit of £4.0 million (2023: £11.0 million and £2.8 million). Recurring management fee income from joint ventures increased to £17.3 million (2023: £16.9 million), driven by increased property valuations and NOI in USAF and LSAV. Our EBIT margin increased slightly to 68.1% (2023: 68.0%), reflecting the offsetting impact of increases in rental income and operating costs. We are targeting up to a 50bps improvement in our EBIT margin in 2025, driven by rental growth, completions of development and asset management projects and efficiencies delivered through procurement and the enhanced use of technology. We expect these factors to more than offset the impact of increases in staff costs linked to higher National Insurance contributions and increases in the Real Living Wage. £m Diluted pence per share EPRA NTA as at 31 December 2023 4,015 920 Investment portfolio 416 85 Yield movement (114) (23) Multiple Dwellings Relief (55) (11) Development portfolio 20 4 Fire safety capex net of claims (17) (3) Capital raise 442 (9) Other 51 9 EPRA NTA as at 31 December 2024 4,758 972 Finance costs reduced to £44.0 million in 2024 (2023: £55.1 million), with the impact of lower borrowings following our capital raise more than offsetting the impact of an increase in our average cost of debt to 3.6% (2023: 3.3%) due to refinancing activity and higher rates on new debt. Capitalised interest linked to our development pipeline increased to £15.5 million (2023: £8.4 million) due to increasing levels of development activity. EPRA NTA GROWTH EPRA net tangible assets (NTA) per share, our key measure of NAV, increased by 6% to 972p at 31 December 2024 (31 December 2023: 920p). EPRA net tangible assets were £4,758 million at 31 December 2024, a £743 million increase from £4,015 million in the prior year. The main drivers of the £743 million increase in EPRA NTA and 52p increase in EPRA NTA per share were our capital raise, and retained profits and valuation gains on our investment and development portfolio, which were partially offset by further deductions for fire safety capex.
 Home for Success: Unite Students Annual Report 2024 Page 38 Page 40