
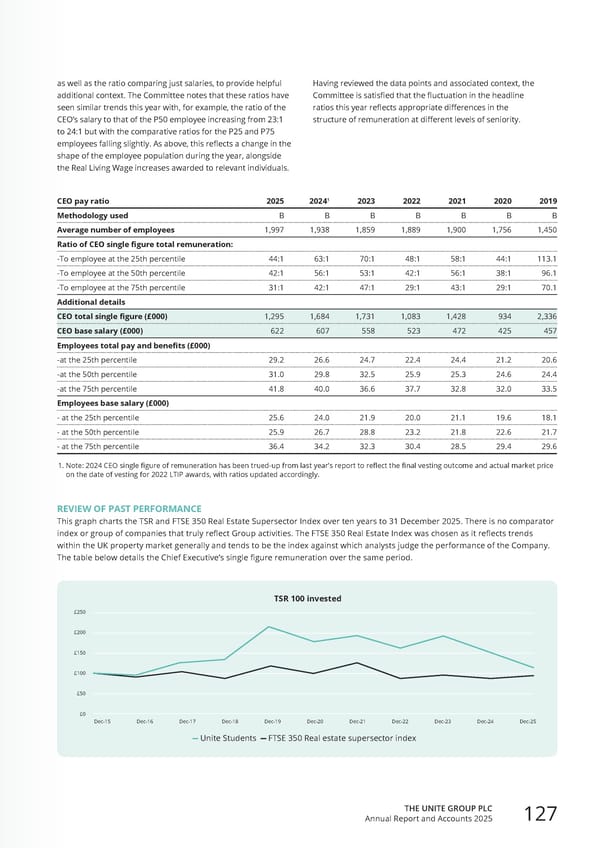
CEO pay ratio 2025 2024 1 2023 2022 2021 2020 2019 Methodology used B B B B B B B Average number of employees 1,997 1,938 1,859 1,889 1,900 1,756 1,450 Ratio of CEO single figure total remuneration: -To employee at the 25th percentile 44:1 63:1 70:1 48:1 58:1 44:1 113.1 -To employee at the 50th percentile 42:1 56:1 53:1 42:1 56:1 38:1 96.1 -To employee at the 75th percentile 31:1 42:1 47:1 29:1 43:1 29:1 70.1 Additional details CEO total single figure (£000) 1,295 1,684 1,731 1,083 1,428 934 2,336 CEO base salary (£000) 622 607 558 523 472 425 457 Employees total pay and benefits (£000) -at the 25th percentile 29.2 26.6 24.7 22.4 24.4 21.2 20.6 -at the 50th percentile 31.0 29.8 32.5 25.9 25.3 24.6 24.4 -at the 75th percentile 41.8 40.0 36.6 37.7 32.8 32.0 33.5 Employees base salary (£000) - at the 25th percentile 25.6 24.0 21.9 20.0 21.1 19.6 18.1 - at the 50th percentile 25.9 26.7 28.8 23.2 21.8 22.6 21.7 - at the 75th percentile 36.4 34.2 32.3 30.4 28.5 29.4 29.6 1. Note: 2024 CEO single figure of remuneration has been trued-up from last year’s report to reflect the final vesting outcome and actual market price on the date of vesting for 2022 LTIP awards, with ratios updated accordingly. REVIEW OF PAST PERFORMANCE This graph charts the TSR and FTSE 350 Real Estate Supersector Index over ten years to 31 December 2025. There is no comparator index or group of companies that truly reflect Group activities. The FTSE 350 Real Estate Index was chosen as it reflects trends within the UK property market generally and tends to be the index against which analysts judge the performance of the Company. The table below details the Chief Executive’s single figure remuneration over the same period. as well as the ratio comparing just salaries, to provide helpful additional context. The Committee notes that these ratios have seen similar trends this year with, for example, the ratio of the CEO’s salary to that of the P50 employee increasing from 23:1 to 24:1 but with the comparative ratios for the P25 and P75 employees falling slightly. As above, this reflects a change in the shape of the employee population during the year, alongside the Real Living Wage increases awarded to relevant individuals. Having reviewed the data points and associated context, the Committee is satisfied that the fluctuation in the headline ratios this year reflects appropriate differences in the structure of remuneration at different levels of seniority. Unite Students FTSE 350 Real estate supersector index TSR 100 invested £250 £200 £150 £100 £50 £0 Dec-15 Dec-16 Dec-17 Dec-18 Dec-19 Dec-20 Dec-21 Dec-22 Dec-23 Dec-24 Dec-25 THE UNITE GROUP PLC Annual Report and Accounts 2025 127
 Home for Success: Unite Students Annual Report 2025 Page 128 Page 130