
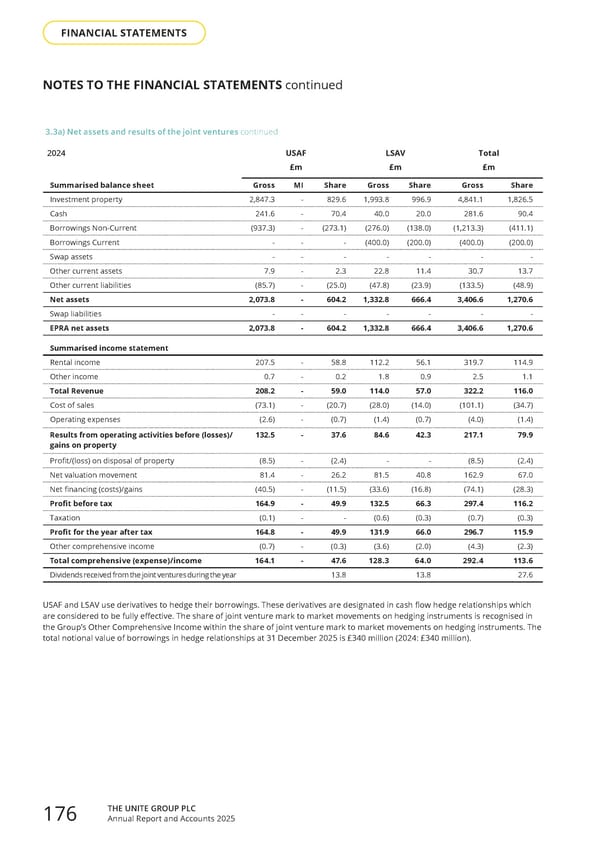
3.3a) Net assets and results of the joint ventures continued USAF and LSAV use derivatives to hedge their borrowings. These derivatives are designated in cash flow hedge relationships which are considered to be fully effective. The share of joint venture mark to market movements on hedging instruments is recognised in the Group’s Other Comprehensive Income within the share of joint venture mark to market movements on hedging instruments. The total notional value of borrowings in hedge relationships at 31 December 2025 is £340 million (2024: £340 million). NOTES TO THE FINANCIAL STATEMENTS continued 2024 USAF LSAV Total £m £m £m Summarised balance sheet Gross MI Share Gross Share Gross Share Investment property 2,847.3 - 829.6 1,993.8 996.9 4,841.1 1,826.5 Cash 241.6 - 70.4 40.0 20.0 281.6 90.4 Borrowings Non-Current (937.3) - (273.1) (276.0) (138.0) (1,213.3) (411.1) Borrowings Current - - - (400.0) (200.0) (400.0) (200.0) Swap assets - - - - - - - Other current assets 7.9 - 2.3 22.8 11.4 30.7 13.7 Other current liabilities (85.7) - (25.0) (47.8) (23.9) (133.5) (48.9) Net assets 2,073.8 - 604.2 1,332.8 666.4 3,406.6 1,270.6 Swap liabilities - - - - - - - EPRA net assets 2,073.8 - 604.2 1,332.8 666.4 3,406.6 1,270.6 Summarised income statement Rental income 207.5 - 58.8 112.2 56.1 319.7 114.9 Other income 0.7 - 0.2 1.8 0.9 2.5 1.1 Total Revenue 208.2 - 59.0 114.0 57.0 322.2 116.0 Cost of sales (73.1) - (20.7) (28.0) (14.0) (101.1) (34.7) Operating expenses (2.6) - (0.7) (1.4) (0.7) (4.0) (1.4) Results from operating activities before (losses)/ gains on property 132.5 - 37.6 84.6 42.3 217.1 79.9 Profit/(loss) on disposal of property (8.5) - (2.4) - - (8.5) (2.4) Net valuation movement 81.4 - 26.2 81.5 40.8 162.9 67.0 Net financing (costs)/gains (40.5) - (11.5) (33.6) (16.8) (74.1) (28.3) Profit before tax 164.9 - 49.9 132.5 66.3 297.4 116.2 Taxation (0.1) - - (0.6) (0.3) (0.7) (0.3) Profit for the year after tax 164.8 - 49.9 131.9 66.0 296.7 115.9 Other comprehensive income (0.7) - (0.3) (3.6) (2.0) (4.3) (2.3) Total comprehensive (expense)/income 164.1 - 47.6 128.3 64.0 292.4 113.6 Dividends received from the joint ventures during the year 13.8 13.8 27.6 THE UNITE GROUP PLC Annual Report and Accounts 2025 176 FINANCIAL STATEMENTS
 Home for Success: Unite Students Annual Report 2025 Page 177 Page 179