
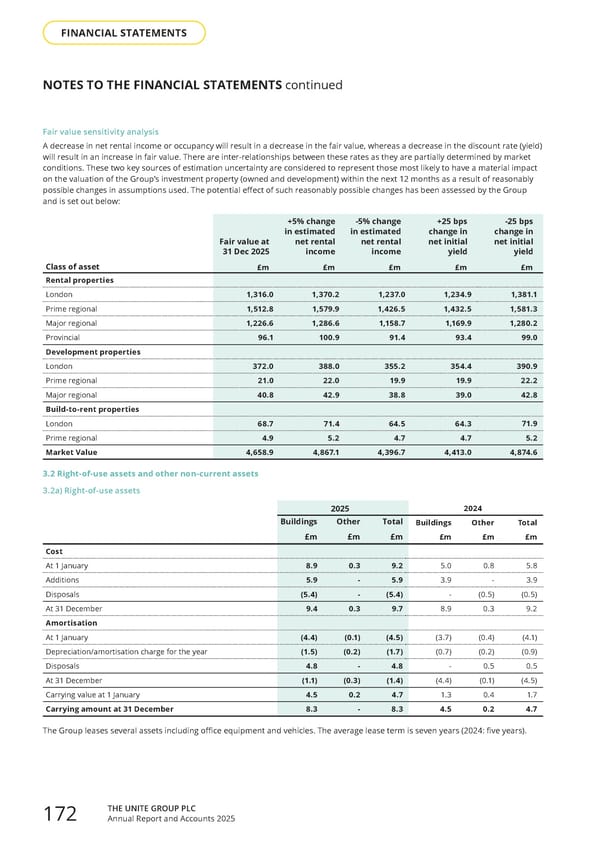
NOTES TO THE FINANCIAL STATEMENTS continued Fair value sensitivity analysis A decrease in net rental income or occupancy will result in a decrease in the fair value, whereas a decrease in the discount rate (yield) will result in an increase in fair value. There are inter-relationships between these rates as they are partially determined by market conditions. These two key sources of estimation uncertainty are considered to represent those most likely to have a material impact on the valuation of the Group’s investment property (owned and development) within the next 12 months as a result of reasonably possible changes in assumptions used. The potential effect of such reasonably possible changes has been assessed by the Group and is set out below: Class of asset Fair value at 31 Dec 2025 +5% change in estimated net rental income -5% change in estimated net rental income +25 bps change in net initial yield £m £m £m £m Rental properties London 1,316.0 1,370.2 1,237.0 1,234.9 Prime regional 1,512.8 1,579.9 1,426.5 1,432.5 Major regional 1,226.6 1,286.6 1,158.7 1,169.9 Provincial 96.1 100.9 91.4 93.4 Development properties London 372.0 388.0 355.2 354.4 Prime regional 21.0 22.0 19.9 19.9 Major regional 40.8 42.9 38.8 39.0 Build-to-rent properties London 68.7 71.4 64.5 64.3 Prime regional 4.9 5.2 4.7 4.7 Market Value 4,658.9 4,867.1 4,396.7 4,413.0 3.2 Right-of-use assets and other non-current assets 3.2a) Right-of-use assets Buildings Other Total £m £m £m Cost At 1 January 8.9 0.3 9.2 Additions 5.9 - 5.9 Disposals (5.4) - (5.4) At 31 December 9.4 0.3 9.7 Amortisation At 1 January (4.4) (0.1) (4.5) Depreciation/amortisation charge for the year (1.5) (0.2) (1.7) Disposals 4.8 - 4.8 At 31 December (1.1) (0.3) (1.4) Carrying value at 1 January 4.5 0.2 4.7 Carrying amount at 31 December 8.3 - 8.3 The Group leases several assets including office equipment and vehicles. The average lease term is seven years (2024: five years). 2024 Buildings Other Total £m £m £m 5.0 0.8 5.8 3.9 - 3.9 - (0.5) (0.5) 8.9 0.3 9.2 (3.7) (0.4) (4.1) (0.7) (0.2) (0.9) - 0.5 0.5 (4.4) (0.1) (4.5) 1.3 0.4 1.7 4.5 0.2 4.7 2025 -25 bps change in net initial yield £m 1,381.1 1,581.3 1,280.2 99.0 390.9 22.2 42.8 71.9 5.2 4,874.6 THE UNITE GROUP PLC Annual Report and Accounts 2025 172 FINANCIAL STATEMENTS
 Home for Success: Unite Students Annual Report 2025 Page 173 Page 175