
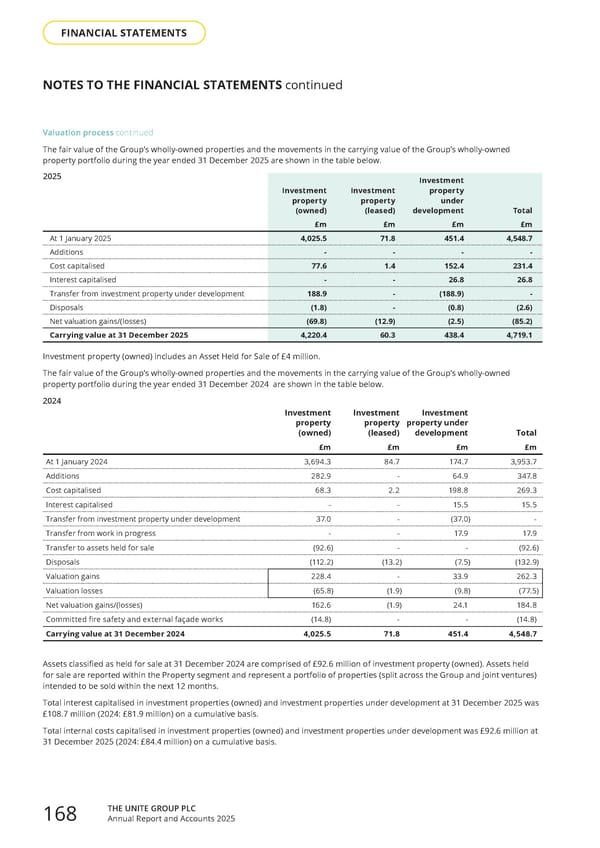
Valuation process continued The fair value of the Group’s wholly-owned properties and the movements in the carrying value of the Group’s wholly-owned property portfolio during the year ended 31 December 2025 are shown in the table below. Investment property (owned) Investment property (leased) Investment property under development Total £m £m £m £m At 1 January 2025 4,025.5 71.8 451.4 4,548.7 Additions - - - - Cost capitalised 77.6 1.4 152.4 231.4 Interest capitalised - - 26.8 26.8 Transfer from investment property under development 188.9 - (188.9) - Disposals (1.8) - (0.8) (2.6) Net valuation gains/(losses) (69.8) (12.9) (2.5) (85.2) Carrying value at 31 December 2025 4,220.4 60.3 438.4 4,719.1 Investment property (owned) includes an Asset Held for Sale of £4 million. The fair value of the Group’s wholly-owned properties and the movements in the carrying value of the Group’s wholly-owned property portfolio during the year ended 31 December 2024 are shown in the table below. 2024 Assets classified as held for sale at 31 December 2024 are comprised of £92.6 million of investment property (owned). Assets held for sale are reported within the Property segment and represent a portfolio of properties (split across the Group and joint ventures) intended to be sold within the next 12 months. Total interest capitalised in investment properties (owned) and investment properties under development at 31 December 2025 was £108.7 million (2024: £81.9 million) on a cumulative basis. Total internal costs capitalised in investment properties (owned) and investment properties under development was £92.6 million at 31 December 2025 (2024: £84.4 million) on a cumulative basis. NOTES TO THE FINANCIAL STATEMENTS continued Investment property (owned) Investment property (leased) Investment property under development Total £m £m £m £m At 1 January 2024 3,694.3 84.7 174.7 3,953.7 Additions 282.9 - 64.9 347.8 Cost capitalised 68.3 2.2 198.8 269.3 Interest capitalised - - 15.5 15.5 Transfer from investment property under development 37.0 - (37.0) - Transfer from work in progress - - 17.9 17.9 Transfer to assets held for sale (92.6) - - (92.6) Disposals (112.2) (13.2) (7.5) (132.9) Valuation gains 228.4 - 33.9 262.3 Valuation losses (65.8) (1.9) (9.8) (77.5) Net valuation gains/(losses) 162.6 (1.9) 24.1 184.8 Committed fire safety and external façade works (14.8) - - (14.8) Carrying value at 31 December 2024 4,025.5 71.8 451.4 4,548.7 2025 THE UNITE G R O U P P LC Annual Report and Accounts 2025 168 FINANCIAL STATEMENTS
 Home for Success: Unite Students Annual Report 2025 Page 169 Page 171