
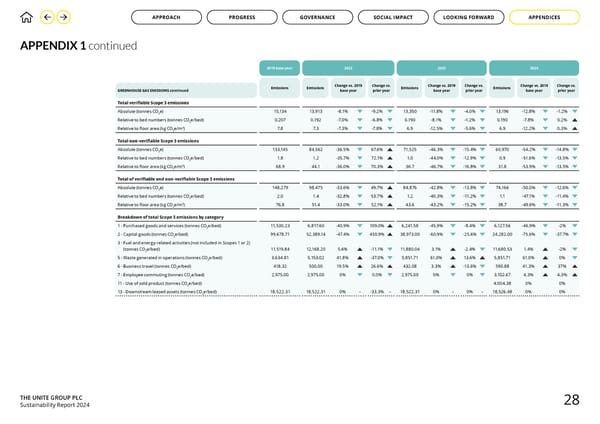
THE UNITE GROUP PLC Sustainability Report 2024 APPENDIX 1 continued GREENHOUSE GAS EMISSIONS 2019 base year 2022 2023 2024 Change vs. 2019 base year Change vs. prior year Change vs. 2019 base year Change vs. prior year Change vs. 2019 base year Change vs. prior year Total verifiable Scope 3 emissions Absolute (tonnes CO2e) 15,134 13,913 -8.1% -9.2% 13,350 -11.8% -4.0% 13,196 -12.8% -1.2% Relative to bed numbers (tonnes CO2e/bed) 0.207 0.192 -7.0% -6.8% 0.190 -8.1% -1.2% 0.190 -7.8% 0.2% Relative to floor area (kg CO2e/m2) 7.8 7.3 -7.3% -7.8% 6.9 -12.5% -5.6% 6.9 -12.2% 0.3% Total non-verifiable Scope 3 emissions Absolute (tonnes CO2e) 133,145 84,562 -36.5% 67.6% 71,525 -46.3% -15.4% 60,970 -54.2% -14.8% Relative to bed numbers (tonnes CO2e/bed) 1.8 1.2 -35.7% 72.1% 1.0 -44.0% -12.9% 0.9 -51.6% -13.5% Relative to floor area (kg CO2e/m2) 68.9 44.1 -36.0% 70.3% 36.7 -46.7% -16.8% 31.8 -53.9% -13.5% Total of verifiable and non-verifiable Scope 3 emissions Absolute (tonnes CO2e) 148,279 98,475 -33.6% 49.7% 84,876 -42.8% -13.8% 74,166 -50.0% -12.6% Relative to bed numbers (tonnes CO2e/bed) 2.0 1.4 -32.8% 53.7% 1.2 -40.3% -11.2% 1.1 -47.1% -11.4% Relative to floor area (kg CO2e/m2) 76.8 51.4 -33.0% 52.1% 43.6 -43.2% -15.2% 38.7 -49.6% -11.3% Breakdown of total Scope 3 emissions by category 1 - Purchased goods and services (tonnes CO2e/bed) 11,530.23 6,817.60 -40.9% 109.0% 6,241.58 -45.9% -8.4% 6,127.56 -46.9% -2% 2 - Capital goods (tonnes CO2e/bed) 99,678.71 52,389.14 -47.4% 450.9% 38,973.00 -60.9% -25.6% 24,282.00 -75.6% -37.7% 3 - Fuel and energy-related activities (not included in Scopes 1 or 2) (tonnes CO2e/bed) 11,519.84 12,168.20 5.6% -11.1% 11,880.04 3.1% -2.4% 11,680.53 1.4% -2% 5 - Waste generated in operations (tonnes CO2e/bed) 3,634.81 5,153.02 41.8% -37.0% 5,851.71 61.0% 13.6% 5,851.71 61.0% 0% 6 - Business travel (tonnes CO2e/bed) 418.32 500.00 19.5% 26.6% 432.08 3.3% -13.6% 590.88 41.3% 37% 7 - Employee commuting (tonnes CO2e/bed) 2,975.00 2,975.00 0% 0.0% 2,975.00 0% 0% 3,102.67 4.3% 4.3% 11 - Use of sold product (tonnes CO2e/bed) 4,004.38 0% 0% 13 - Downstream leased assets (tonnes CO2e/bed) 18,522.31 18,522.31 0% – -33.3% – 18,522.31 0% – 0% – 18,526.48 0% 0% Emissions Emissions Emissions Emissions continued 28 GOVERNANCE APPROACH PROGRESS SOCIAL IMPACT LOOKING FORWARD APPENDICES
 Making a Positive Impact: Unite Students Sustainability Report 2024 Page 28 Page 30