
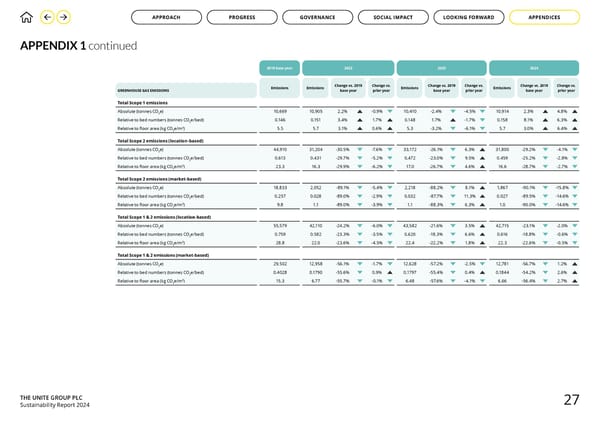
THE UNITE GROUP PLC Sustainability Report 2024 APPENDIX 1 continued GREENHOUSE GAS EMISSIONS 2019 base year 2022 2023 2024 Change vs. 2019 base year Change vs. prior year Change vs. 2019 base year Change vs. prior year Change vs. 2019 base year Change vs. prior year Total Scope 1 emissions Absolute (tonnes CO2e) 10,669 10,905 2.2% -0.9% 10,410 -2.4% -4.5% 10,914 2.3% 4.8% Relative to bed numbers (tonnes CO2e/bed) 0.146 0.151 3.4% 1.7% 0.148 1.7% -1.7% 0.158 8.1% 6.3% Relative to floor area (kg CO2e/m2) 5.5 5.7 3.1% 0.6% 5.3 -3.2% -6.1% 5.7 3.0% 6.4% Total Scope 2 emissions (location-based) Absolute (tonnes CO2e) 44,910 31,204 -30.5% -7.6% 33,172 -26.1% 6.3% 31,800 -29.2% -4.1% Relative to bed numbers (tonnes CO2e/bed) 0.613 0.431 -29.7% -5.2% 0.472 -23.0% 9.5% 0.459 -25.2% -2.8% Relative to floor area (kg CO2e/m2) 23.3 16.3 -29.9% -6.2% 17.0 -26.7% 4.6% 16.6 -28.7% -2.7% Total Scope 2 emissions (market-based) Absolute (tonnes CO2e) 18,833 2,052 -89.1% -5.4% 2,218 -88.2% 8.1% 1,867 -90.1% -15.8% Relative to bed numbers (tonnes CO2e/bed) 0.257 0.028 -89.0% -2.9% 0.032 -87.7% 11.3% 0.027 -89.5% -14.6% Relative to floor area (kg CO2e/m2) 9.8 1.1 -89.0% -3.9% 1.1 -88.3% 6.3% 1.0 -90.0% -14.6% Total Scope 1 & 2 emissions (location-based) Absolute (tonnes CO2e) 55,579 42,110 -24.2% -6.0% 43,582 -21.6% 3.5% 42,715 -23.1% -2.0% Relative to bed numbers (tonnes CO2e/bed) 0.759 0.582 -23.3% -3.5% 0.620 -18.3% 6.6% 0.616 -18.8% -0.6% Relative to floor area (kg CO2e/m2) 28.8 22.0 -23.6% -4.5% 22.4 -22.2% 1.8% 22.3 -22.6% -0.5% Total Scope 1 & 2 emissions (market-based) Absolute (tonnes CO2e) 29,502 12,958 -56.1% -1.7% 12,628 -57.2% -2.5% 12,781 -56.7% 1.2% Relative to bed numbers (tonnes CO2e/bed) 0.4028 0.1790 -55.6% 0.9% 0.1797 -55.4% 0.4% 0.1844 -54.2% 2.6% Relative to floor area (kg CO2e/m2) 15.3 6.77 -55.7% -0.1% 6.48 -57.6% -4.1% 6.66 -56.4% 2.7% Emissions Emissions Emissions Emissions 27 GOVERNANCE APPROACH PROGRESS SOCIAL IMPACT LOOKING FORWARD APPENDICES
 Making a Positive Impact: Unite Students Sustainability Report 2024 Page 27 Page 29