
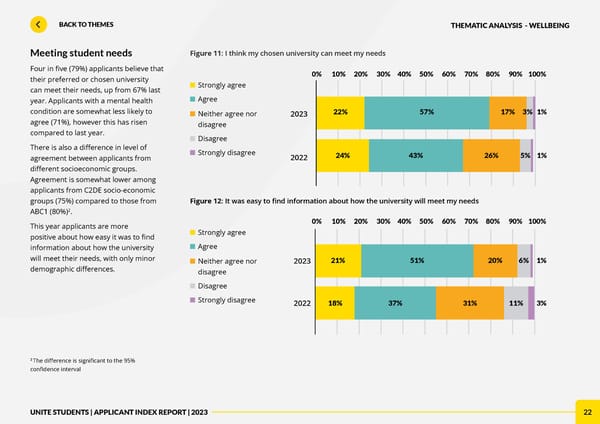
22 BACK TO THEMES U NITE STUDENTS | APPLICANT INDEX REPORT | 2023 Meeting student needs Four in five (79%) applicants believe that their preferred or chosen university can meet their needs, up from 67% last year. Applicants with a mental health condition are somewhat less likely to agree (71%), however this has risen compared to last year. There is also a difference in level of agreement between applicants from different socioeconomic groups. Agreement is somewhat lower among applicants from C2DE socio-economic groups (75%) compared to those from ABC1 (80%) 2 . This year applicants are more positive about how easy it was to find information about how the university will meet their needs, with only minor demographic differences. 2023 2022 Figure 11 : I think my chosen university can meet my needs Figure 12 : It was easy to find information about how the university will meet my needs ■ Strongly agree ■ Agree ■ Neither agree nor disagree ■ Disagree ■ Strongly disagree ■ Strongly agree ■ Agree ■ Neither agree nor disagree ■ Disagree ■ Strongly disagree 2023 24% 22% 43% 57% 26% 17% 5% 3% 1% 1% 2022 21% 18% 51% 37% 20% 31% 6% 11% 1% 3% THEMATIC ANALYSIS - WELLBEING 0% 0% 100% 100% 80% 80% 50% 50% 20% 20% 90% 90% 60% 60% 30% 30% 70% 70% 40% 40% 10% 10% 2 The difference is significant to the 95% confidence interval
 Unite Applicant Index Report 2023 Page 21 Page 23