
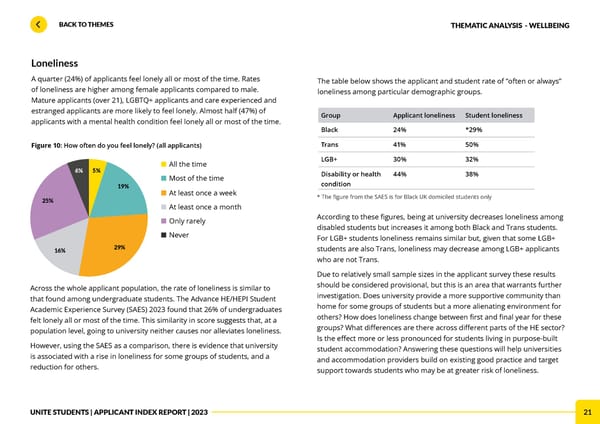
21 BACK TO THEMES U NITE STUDENTS | APPLICANT INDEX REPORT | 2023 Loneliness A quarter (24%) of applicants feel lonely all or most of the time. Rates of loneliness are higher among female applicants compared to male. Mature applicants (over 21), LGBTQ+ applicants and care experienced and estranged applicants are more likely to feel lonely. Almost half (47%) of applicants with a mental health condition feel lonely all or most of the time. Across the whole applicant population, the rate of loneliness is similar to that found among undergraduate students. The Advance HE/HEPI Student Academic Experience Survey (SAES) 2023 found that 26% of undergraduates felt lonely all or most of the time. This similarity in score suggests that, at a population level, going to university neither causes nor alleviates loneliness. However, using the SAES as a comparison, there is evidence that university is associated with a rise in loneliness for some groups of students, and a reduction for others. According to these figures, being at university decreases loneliness among disabled students but increases it among both Black and Trans students. For LGB+ students loneliness remains similar but, given that some LGB+ students are also Trans, loneliness may decrease among LGB+ applicants who are not Trans. Due to relatively small sample sizes in the applicant survey these results should be considered provisional, but this is an area that warrants further investigation. Does university provide a more supportive community than home for some groups of students but a more alienating environment for others? How does loneliness change between first and final year for these groups? What differences are there across different parts of the HE sector? Is the effect more or less pronounced for students living in purpose-built student accommodation? Answering these questions will help universities and accommodation providers build on existing good practice and target support towards students who may be at greater risk of loneliness. Group Applicant loneliness Student loneliness Black 24% *29% Trans 41% 50% LGB+ 30% 32% Disability or health condition 44% 38% Figure 10 : How often do you feel lonely? (all applicants) The table below shows the applicant and student rate of “often or always” loneliness among particular demographic groups. ■ All the time ■ Most of the time ■ At least once a week ■ At least once a month ■ Only rarely ■ Never 25% 19% 29% 5% 16% 6% * The figure from the SAES is for Black UK domiciled students only THEMATIC ANALYSIS - WELLBEING
 Unite Applicant Index Report 2023 Page 20 Page 22