
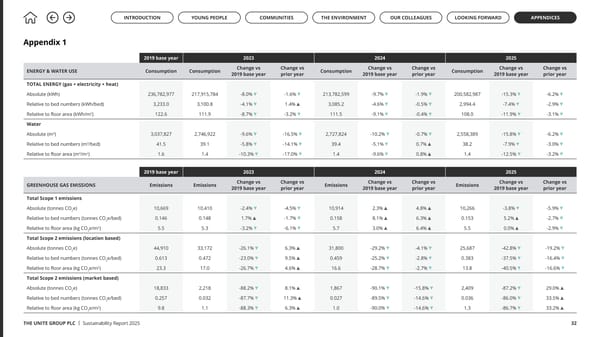
THE UNITE GROUP PLC | Sustainability Report 2025 32 2019 base year 2023 2024 2025 ENERGY & WATER USE Consumption Consumption Change vs 2019 base year Change vs prior year Consumption Change vs 2019 base year Change vs prior year Consumption Change vs 2019 base year Change vs prior year TOTAL ENERGY (gas + electricity + heat) Absolute (kWh) 236,782,977 217,915,784 -8.0% -1.6% 213,782,599 -9.7% -1.9% 200,582,987 -15.3% -6.2% Relative to bed numbers (kWh/bed) 3,233.0 3,100.8 -4.1% 1.4% 3,085.2 -4.6% -0.5% 2,994.4 -7.4% -2.9% Relative to floor area (kWh/m 2 ) 122.6 111.9 -8.7% -3.2% 111.5 -9.1% -0.4% 108.0 -11.9% -3.1% Water Absolute (m 3 ) 3,037,827 2,746,922 -9.6% -16.5% 2,727,824 -10.2% -0.7% 2,558,389 -15.8% -6.2% Relative to bed numbers (m 3 /bed) 41.5 39.1 -5.8% -14.1% 39.4 -5.1% 0.7% 38.2 -7.9% -3.0% Relative to floor area (m 3 /m 2 ) 1.6 1.4 -10.3% -17.0% 1.4 -9.6% 0.8% 1.4 -12.5% -3.2% Appendix 1 2019 base year 2023 2024 2025 GREENHOUSE GAS EMISSIONS Emissions Emissions Change vs 2019 base year Change vs prior year Emissions Change vs 2019 base year Change vs prior year Emissions Change vs 2019 base year Change vs prior year Total Scope 1 emissions Absolute (tonnes CO 2 e) 10,669 10,410 -2.4% -4.5% 10,914 2.3% 4.8% 10,266 -3.8% -5.9% Relative to bed numbers (tonnes CO 2 e/bed) 0.146 0.148 1.7% -1.7% 0.158 8.1% 6.3% 0.153 5.2% -2.7% Relative to floor area (kg CO 2 e/m 2 ) 5.5 5.3 -3.2% -6.1% 5.7 3.0% 6.4% 5.5 0.0% -2.9% Total Scope 2 emissions (location based) Absolute (tonnes CO 2 e) 44,910 33,172 -26.1% 6.3% 31,800 -29.2% -4.1% 25,687 -42.8% -19.2% Relative to bed numbers (tonnes CO 2 e/bed) 0.613 0.472 -23.0% 9.5% 0.459 -25.2% -2.8% 0.383 -37.5% -16.4% Relative to floor area (kg CO 2 e/m 2 ) 23.3 17.0 -26.7% 4.6% 16.6 -28.7% -2.7% 13.8 -40.5% -16.6% Total Scope 2 emissions (market based) Absolute (tonnes CO 2 e) 18,833 2,218 -88.2% 8.1% 1,867 -90.1% -15.8% 2,409 -87.2% 29.0% Relative to bed numbers (tonnes CO 2 e/bed) 0.257 0.032 -87.7% 11.3% 0.027 -89.5% -14.6% 0.036 -86.0% 33.5% Relative to floor area (kg CO 2 e/m 2 ) 9.8 1.1 -88.3% 6.3% 1.0 -90.0% -14.6% 1.3 -86.7% 33.2% INTRODUCTION YOUNG PEOPLE COMMUNITIES OUR COLLEAGUES THE ENVIRONMENT APPENDICES LOOKING FORWARD
 Up to US: The Unite Group Sustainability Report 2025 Page 31 Page 33