
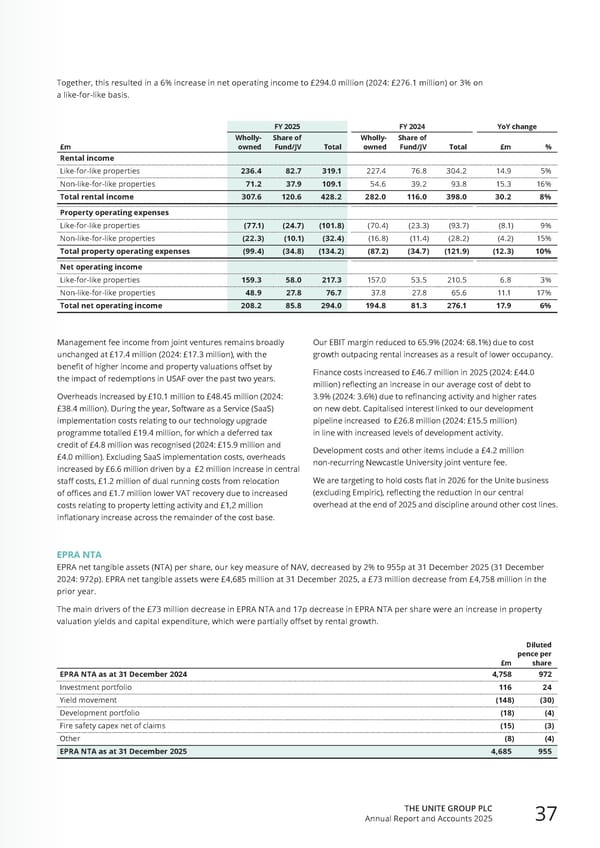
FY 2025 FY 2024 YoY change £m Wholly- owned Share of Fund/JV Total Wholly- owned Share of Fund/JV Total £m % Rental income Like-for-like properties 236.4 82.7 319.1 227.4 76.8 304.2 14.9 5% Non-like-for-like properties 71.2 37.9 109.1 54.6 39 .2 93. 8 15.3 16% Total rental income 307.6 120.6 428.2 282.0 116.0 398.0 30.2 8% Property operating expenses Like-for-like properties (77.1) (24.7) (101.8) (70.4) (23.3) (93.7) (8.1) 9% Non-like-for-like properties (22.3) (10.1) (32.4) (16.8) (11.4) (28.2) (4.2) 15% Total property operating expenses (99.4) (34.8) (134.2) (87.2) (34.7) (121.9) (12.3) 10% Net operating income Like-for-like properties 159.3 58.0 217.3 157.0 53.5 210.5 6.8 3% Non-like-for-like properties 48.9 27.8 76.7 37.8 27.8 65.6 11.1 17% Total net operating income 208.2 85.8 294.0 194.8 81.3 276.1 17.9 6% Management fee income from joint ventures remains broadly unchanged at £17.4 million (2024: £17.3 million), with the benefit of higher income and property valuations offset by the impact of redemptions in USAF over the past two years. Overheads increased by £10.1 million to £48.45 million (2024: £38.4 million). During the year, Software as a Service (SaaS) implementation costs relating to our technology upgrade programme totalled £19.4 million, for which a deferred tax credit of £4.8 million was recognised (2024: £15.9 million and £4.0 million). Excluding SaaS implementation costs, overheads increased by £6.6 million driven by a £2 million increase in central staff costs, £1.2 million of dual running costs from relocation of offices and £1.7 million lower VAT recovery due to increased costs relating to property letting activity and £1,2 million inflationary increase across the remainder of the cost base. £m Diluted pence per share EPRA NTA as at 31 December 2024 4,758 972 Investment portfolio 116 24 Yield movement (148) (30) Development portfolio (18) (4) Fire safety capex net of claims (15) (3) Other (8) (4) EPRA NTA as at 31 December 2025 4,685 955 Our EBIT margin reduced to 65.9% (2024: 68.1%) due to cost growth outpacing rental increases as a result of lower occupancy. Finance costs increased to £46.7 million in 2025 (2024: £44.0 million) reflecting an increase in our average cost of debt to 3.9% (2024: 3.6%) due to refinancing activity and higher rates on new debt. Capitalised interest linked to our development pipeline increased to £26.8 million (2024: £15.5 million) in line with increased levels of development activity. Development costs and other items include a £4.2 million non-recurring Newcastle University joint venture fee. We are targeting to hold costs flat in 2026 for the Unite business (excluding Empiric), reflecting the reduction in our central overhead at the end of 2025 and discipline around other cost lines. Together, this resulted in a 6% increase in net operating income to £294.0 million (2024: £276.1 million) or 3% on a like-for-like basis. EPRA NTA EPRA net tangible assets (NTA) per share, our key measure of NAV, decreased by 2% to 955p at 31 December 2025 (31 December 2024: 972p). EPRA net tangible assets were £4,685 million at 31 December 2025, a £73 million decrease from £4,758 million in the prior year. The main drivers of the £73 million decrease in EPRA NTA and 17p decrease in EPRA NTA per share were an increase in property valuation yields and capital expenditure, which were partially offset by rental growth. THE UNITE GROUP PLC Annual Report and Accounts 2025 37
 Home for Success: Unite Students Annual Report 2025 Page 38 Page 40