
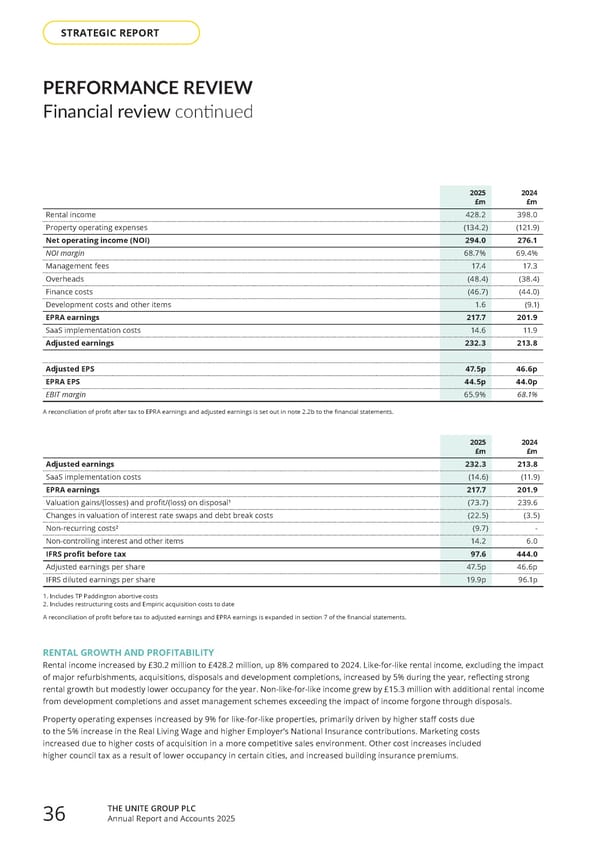
PERFORMANCE REVIEW Financial review continued 2025 £m 2024 £m Adjusted earnings 232.3 213.8 SaaS implementation costs (14.6) (11.9) EPRA earnings 217.7 201.9 Valuation gains/(losses) and profit/(loss) on disposal¹ (73.7) 239.6 Changes in valuation of interest rate swaps and debt break costs (22.5) (3.5) Non-recurring costs² (9.7) - Non-controlling interest and other items 14.2 6.0 IFRS profit before tax 97.6 444.0 Adjusted earnings per share 47.5p 46.6p IFRS diluted earnings per share 19.9p 96.1p 1. Includes TP Paddington abortive costs 2. Includes restructuring costs and Empiric acquisition costs to date A reconciliation of profit before tax to adjusted earnings and EPRA earnings is expanded in section 7 of the financial statements. 2025 £m 2024 £m Rental income 428.2 398.0 Property operating expenses (134.2) (121.9) Net operating income (NOI) 294.0 276.1 NOI margin 68.7% 69.4% Management fees 17.4 17.3 Overheads (48.4) (38.4) Finance costs (46.7) (44.0) Development costs and other items 1.6 (9.1) EPRA earnings 217.7 201.9 SaaS implementation costs 14.6 11.9 Adjusted earnings 232.3 213.8 Adjusted EPS 47.5p 46.6p EPRA EPS 44.5p 44.0p EBIT margin 65.9% 68.1% A reconciliation of profit after tax to EPRA earnings and adjusted earnings is set out in note 2.2b to the financial statements. RENTAL GROWTH AND PROFITABILITY Rental income increased by £30.2 million to £428.2 million, up 8% compared to 2024. Like-for-like rental income, excluding the impact of major refurbishments, acquisitions, disposals and development completions, increased by 5% during the year, reflecting strong rental growth but modestly lower occupancy for the year. Non-like-for-like income grew by £15.3 million with additional rental income from development completions and asset management schemes exceeding the impact of income forgone through disposals. Property operating expenses increased by 9% for like-for-like properties, primarily driven by higher staff costs due to the 5% increase in the Real Living Wage and higher Employer’s National Insurance contributions. Marketing costs increased due to higher costs of acquisition in a more competitive sales environment. Other cost increases included higher council tax as a result of lower occupancy in certain cities, and increased building insurance premiums. THE UNITE GROUP PLC Annual Report and Accounts 2025 36 STRATEGIC REPORT
 Home for Success: Unite Students Annual Report 2025 Page 37 Page 39