
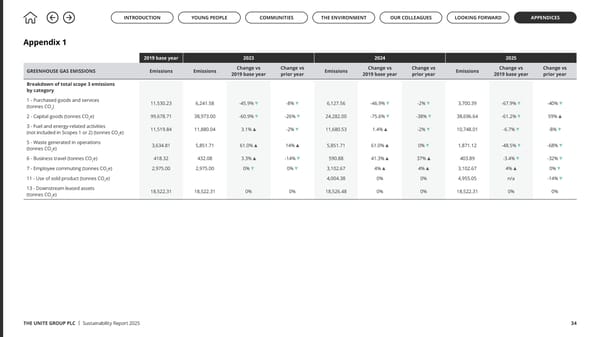
THE UNITE GROUP PLC | Sustainability Report 2025 34 Appendix 1 2019 base year 2023 2024 2025 GREENHOUSE GAS EMISSIONS Emissions Emissions Change vs 2019 base year Change vs prior year Emissions Change vs 2019 base year Change vs prior year Emissions Change vs 2019 base year Change vs prior year Breakdown of total scope 3 emissions by category 1 - Purchased goods and services (tonnes CO 2 ) 11,530.23 6,241.58 -45.9% -8% 6,127.56 -46.9% -2% 3,700.39 -67.9% -40% 2 - Capital goods (tonnes CO 2 e) 99,678.71 38,973.00 -60.9% -26% 24,282.00 -75.6% -38% 38,696.64 -61.2% 59% 3 - Fuel and energy-related activities (not included in Scopes 1 or 2) (tonnes CO 2 e) 11,519.84 11,880.04 3.1% -2% 11,680.53 1.4% -2% 10,748.01 -6.7% -8% 5 - Waste generated in operations (tonnes CO 2 e) 3,634.81 5,851.71 61.0% 14% 5,851.71 61.0% 0% 1,871.12 -48.5% -68% 6 - Business travel (tonnes CO 2 e) 418.32 432.08 3.3% -14% 590.88 41.3% 37% 403.89 -3.4% -32% 7 - Employee commuting (tonnes CO 2 e) 2,975.00 2,975.00 0% 0% 3,102.67 4% 4% 3,102.67 4% 0% 11 - Use of sold product (tonnes CO 2 e) 4,004.38 0% 0% 4,955.05 n/a -14% 13 - Downstream leased assets (tonnes CO 2 e) 18,522.31 18,522.31 0% 0% 18,526.48 0% 0% 18,522.31 0% 0% INTRODUCTION YOUNG PEOPLE COMMUNITIES OUR COLLEAGUES THE ENVIRONMENT LOOKING FORWARD APPENDICES
 Up to US: The Unite Group Sustainability Report 2025 Page 33 Page 35