Unite Applicant Index Report
Get to know this year’s university applicants in our 2024 Applicant Index - the only research to give each year’s applicants a voice as they prepare for university life.
In partnership with UNITE STUDENTS APPLICANT INDEX July 2024
Contents 1 Introduction 3 3 Topical issues 36 Foreword - Joe Lister 4 The Transition to Higher Education 37 Foreword - Nick Hillman 5 Alternatives to university 38 Executive Summary 6 Withdrawing before enrolment 39 About the Applicant Index 8 Data sharing 40 Notes on data categories 9 The Applicant Index Scores 2022-24 10 4 Methodology 41 Introducing the Themes 11 Methodology 42 2 Thematic Analysis 12 Finance 13 Social 19 Community 21 Wellbeing 23 Resilience 27 Learning 28 Employment 32 Independence 33 Sustainability 35 Unite Students | Applicant Index Report 2
1 Introduc琀椀on Unite Students | Applicant Index Report 3
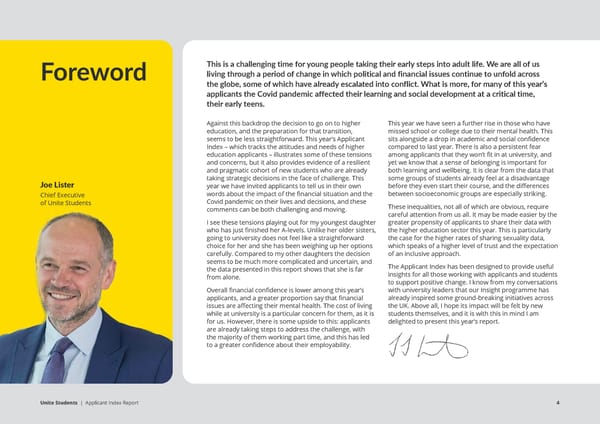
This is a challenging time for young people taking their early steps into adult life. We are all of us Foreword living through a period of change in which political and financial issues continue to unfold across the globe, some of which have already escalated into conflict. What is more, for many of this year’s applicants the Covid pandemic affected their learning and social development at a critical time, their early teens. Against this backdrop the decision to go on to higher This year we have seen a further rise in those who have education, and the preparation for that transition, missed school or college due to their mental health. This seems to be less straightforward. This year’s Applicant sits alongside a drop in academic and social confidence Index – which tracks the attitudes and needs of higher compared to last year. There is also a persistent fear education applicants – illustrates some of these tensions among applicants that they won’t fit in at university, and and concerns, but it also provides evidence of a resilient yet we know that a sense of belonging is important for and pragmatic cohort of new students who are already both learning and wellbeing. It is clear from the data that Joe Lister taking strategic decisions in the face of challenge. This some groups of students already feel at a disadvantage year we have invited applicants to tell us in their own before they even start their course, and the differences Chief Executive words about the impact of the financial situation and the between socioeconomic groups are especially striking. of Unite Students Covid pandemic on their lives and decisions, and these These inequalities, not all of which are obvious, require comments can be both challenging and moving. careful attention from us all. It may be made easier by the I see these tensions playing out for my youngest daughter greater propensity of applicants to share their data with who has just finished her A-levels. Unlike her older sisters, the higher education sector this year. This is particularly going to university does not feel like a straightforward the case for the higher rates of sharing sexuality data, choice for her and she has been weighing up her options which speaks of a higher level of trust and the expectation carefully. Compared to my other daughters the decision of an inclusive approach. seems to be much more complicated and uncertain, and The Applicant Index has been designed to provide useful the data presented in this report shows that she is far insights for all those working with applicants and students from alone. to support positive change. I know from my conversations Overall financial confidence is lower among this year’s with university leaders that our Insight programme has applicants, and a greater proportion say that financial already inspired some ground-breaking initiatives across issues are affecting their mental health. The cost of living the UK. Above all, I hope its impact will be felt by new while at university is a particular concern for them, as it is students themselves, and it is with this in mind I am for us. However, there is some upside to this: applicants delighted to present this year’s report. are already taking steps to address the challenge, with the majority of them working part time, and this has led to a greater confidence about their employability. Unite Students | Applicant Index Report 4
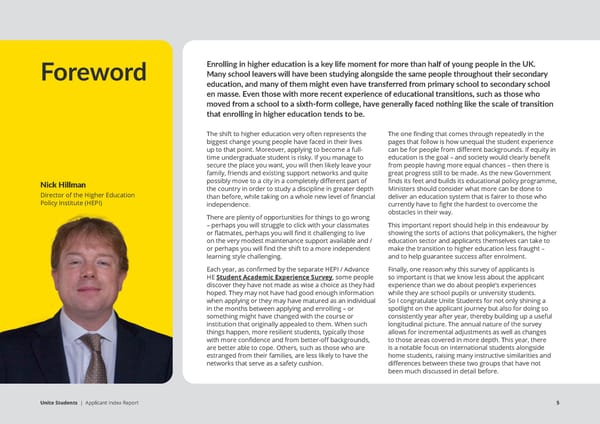
Enrolling in higher education is a key life moment for more than half of young people in the UK. Foreword Many school leavers will have been studying alongside the same people throughout their secondary education, and many of them might even have transferred from primary school to secondary school en masse. Even those with more recent experience of educational transitions, such as those who moved from a school to a sixth-form college, have generally faced nothing like the scale of transition that enrolling in higher education tends to be. The shift to higher education very often represents the The one finding that comes through repeatedly in the biggest change young people have faced in their lives pages that follow is how unequal the student experience up to that point. Moreover, applying to become a full- can be for people from different backgrounds. If equity in time undergraduate student is risky. If you manage to education is the goal – and society would clearly benefit secure the place you want, you will then likely leave your from people having more equal chances – then there is family, friends and existing support networks and quite great progress still to be made. As the new Government Nick Hillman possibly move to a city in a completely different part of finds its feet and builds its educational policy programme, the country in order to study a discipline in greater depth Ministers should consider what more can be done to Director of the Higher Education than before, while taking on a whole new level of financial deliver an education system that is fairer to those who Policy Institute (HEPI) independence. currently have to fight the hardest to overcome the There are plenty of opportunities for things to go wrong obstacles in their way. – perhaps you will struggle to click with your classmates This important report should help in this endeavour by or flatmates, perhaps you will find it challenging to live showing the sorts of actions that policymakers, the higher on the very modest maintenance support available and / education sector and applicants themselves can take to or perhaps you will find the shift to a more independent make the transition to higher education less fraught – learning style challenging. and to help guarantee success after enrolment. Each year, as confirmed by the separate HEPI / Advance Finally, one reason why this survey of applicants is HE Student Academic Experience Survey, some people so important is that we know less about the applicant discover they have not made as wise a choice as they had experience than we do about people’s experiences hoped. They may not have had good enough information while they are school pupils or university students. when applying or they may have matured as an individual So I congratulate Unite Students for not only shining a in the months between applying and enrolling – or spotlight on the applicant journey but also for doing so something might have changed with the course or consistently year after year, thereby building up a useful institution that originally appealed to them. When such longitudinal picture. The annual nature of the survey things happen, more resilient students, typically those allows for incremental adjustments as well as changes with more confidence and from better-off backgrounds, to those areas covered in more depth. This year, there are better able to cope. Others, such as those who are is a notable focus on international students alongside estranged from their families, are less likely to have the home students, raising many instructive similarities and networks that serve as a safety cushion. differences between these two groups that have not been much discussed in detail before. Unite Students | Applicant Index Report 5
Execu琀椀ve Summary This year’s applicants will enter higher education with a higher level of optimism about their future employability, but less financial confidence and with significantly lower confidence in their academic skills compared to the previous two cohorts. Furthermore, about a third think it likely that they will not take up their place at university, though the majority of these only think it ‘somewhat likely’. Qualitative data suggests that this cohort is carrying Rates of absence due to mental health are higher is down on last year, and two in five applicants say a strong sense of loss due to the pandemic which, among female applicants than male, and significantly that financial issues are affecting their mental health, for most respondents, took place in their early teens. higher among LGBTQ+ applicants. While most which is an increase from last year: cost of living is This encompasses both learning and social losses, absences due to mental health are short, almost their area of greatest concern. Applicants described leaving a legacy of missed opportunities, poorer one in ten (9%) of all applicants have been absent in their own words the impact of cost of living on concentration and motivation, and a strong sense for more than 20 days due to mental health. Among their choice of university, with one in five mentioning of social anxiety. those who had been absent, 43% thought they location. Comments suggested that some applicants Learning confidence may also have been affected would need to miss teaching time at university due were choosing cheaper options, including limiting by school absence due to mental health, which has to their mental health. This represents a significant their choices to more budget-friendly cities. Others increased further this year from last year’s already minority (15%) of the total applicant population. had made a financial choice to live at home, though high base of 30%. Over a third (36%) of this year’s Overall, financial confidence among this year’s when asked about their accommodation intentions, applicants have missed school or college over the cohort is slightly lower than last year and on a par there was no evidence that we will see a higher rate last two years due to their mental health, rising to with attitudes in 2022. Confidence in budgeting skills of living at home this year. 39% among UK applicants. Unite Students | Applicant Index Report 6
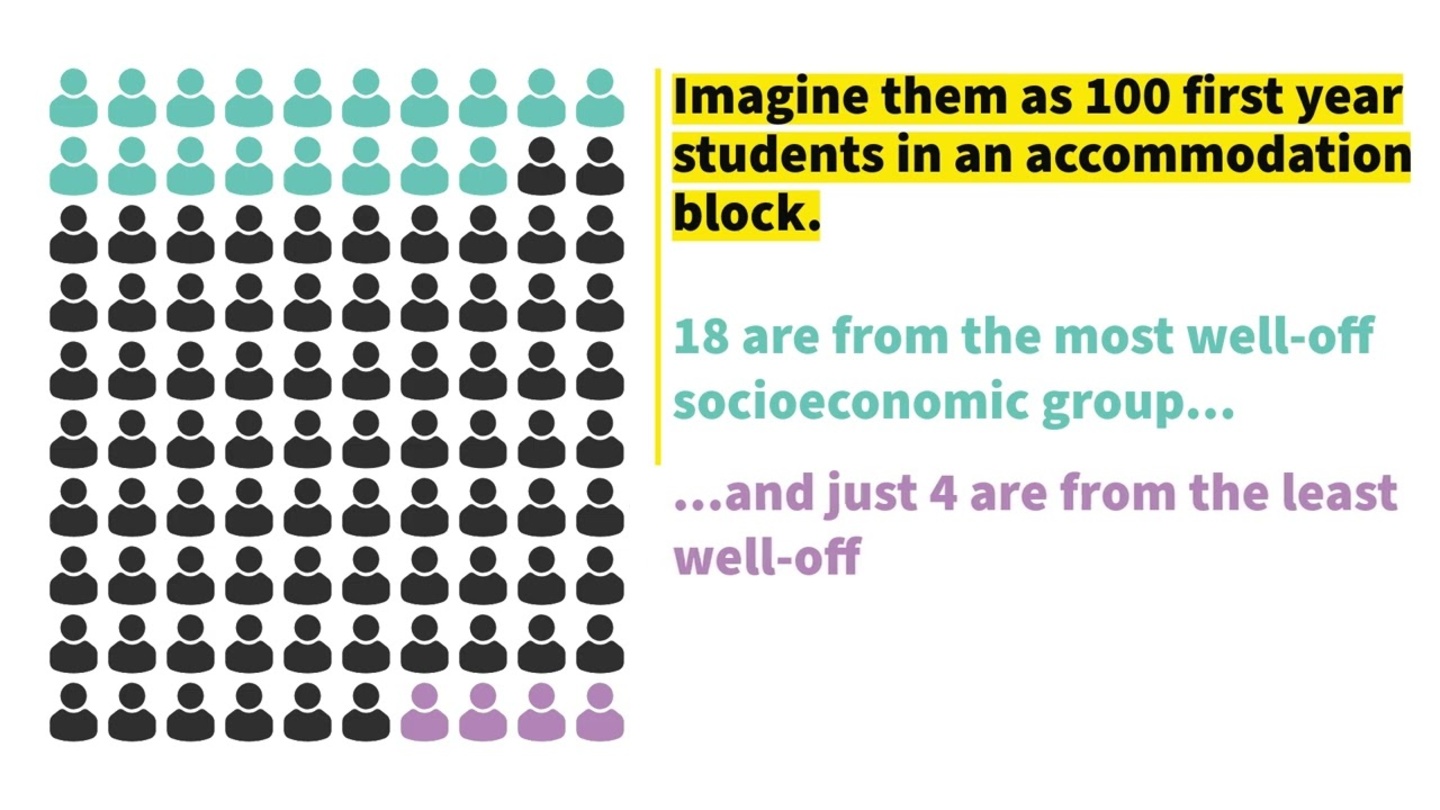
There has been a notable rise in confidence about future job prospects this year. Two in five strongly agree that they are confident about getting the job they want after graduation, up 6 percentage points on last year. This year’s applicants also have higher levels of perceived work experience and employability skills, and are slightly more likely to have done paid work in the last two years. International applicants are more confident than their UK domiciled counterparts when it comes to their employability. For UK applicants, those from the higher socioeconomic groups are the most confident in their job prospects. This is not the only example of socioeconomic disadvantage found in this survey – in fact it affects a range of applicant attitudes and experiences. Socioeconomic status affects financial confidence, which was anticipated, but, less predictably, it also affects social and learning confidence. Applicants from lower socioeconomic groups are more likely to be anxious about fitting in at university, and they anticipate a lower level of welcome and belonging. They have less confidence in their ability to learn the knowledge and skills needed for their course, and they are more likely to have missed education due to their mental health. They are also lonelier than their peers. In other words, applicants from D and E socioeconomic groups (semi-skilled, unskilled and workless households) are having a poorer experience now and are not necessarily confident that things will improve when they go to university. Unite Students | Applicant Index Report 7
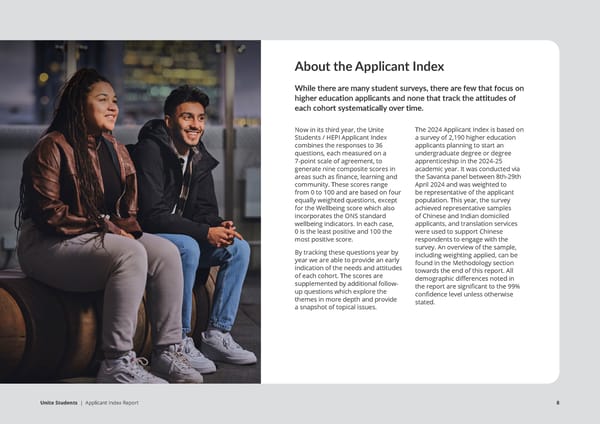
About the Applicant Index While there are many student surveys, there are few that focus on higher education applicants and none that track the attitudes of each cohort systematically over time. Now in its third year, the Unite The 2024 Applicant Index is based on Students / HEPI Applicant Index a survey of 2,190 higher education combines the responses to 36 applicants planning to start an questions, each measured on a undergraduate degree or degree 7-point scale of agreement, to apprenticeship in the 2024-25 generate nine composite scores in academic year. It was conducted via areas such as finance, learning and the Savanta panel between 8th-29th community. These scores range April 2024 and was weighted to from 0 to 100 and are based on four be representative of the applicant equally weighted questions, except population. This year, the survey for the Wellbeing score which also achieved representative samples incorporates the ONS standard of Chinese and Indian domiciled wellbeing indicators. In each case, applicants, and translation services 0 is the least positive and 100 the were used to support Chinese most positive score. respondents to engage with the By tracking these questions year by survey. An overview of the sample, year we are able to provide an early including weighting applied, can be indication of the needs and attitudes found in the Methodology section of each cohort. The scores are towards the end of this report. All supplemented by additional follow- demographic differences noted in up questions which explore the the report are significant to the 99% themes in more depth and provide confidence level unless otherwise a snapshot of topical issues. stated. Unite Students | Applicant Index Report 8
Notes on data categories Gender and sexuality Demographic data about gender identity and sexuality was collected via three distinct questions: a question about sexuality, a question about gender and the question ‘Do you consider yourself to be trans?’ Responses from applicants that answered ‘Yes’ to this latter question, and/ or gave ‘non-binary as their gender identity, are categorised trans/non-binary in the report. A separate question asked applicants how they think about themselves, with a list of different sexualities including ‘in another way’. Those who selected any other option apart from ‘heterosexual’ or ‘prefer not to say’ have been categorised as LGB+ within the report. Where there are significant differences in response to a survey question for both LGB+ and trans/non-binary applicants, they are categorised as LGBTQ+. Socioeconomic group Socioeconomic breakdown of the results uses the NRS (National Readership Survey) Social Grade system, which assigns a category based on the main wage earner in the participant’s current household. There are six categories: A, B, C1, C2, D and E. Roughly, A represents the most affluent households and E the least affluent. A full {definition of these categories can be found in the Methodology section. Unite Students | Applicant Index Report 9
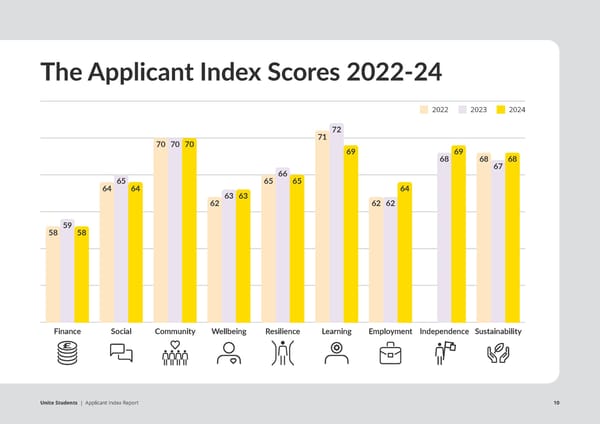
The Applicant Index Scores 2022-24 2022 2023 2024 71 72 70 70 70 69 69 68 68 67 68 65 65 66 65 64 64 63 63 64 62 62 62 58 59 58 Finance Social Community Wellbeing Resilience Learning Employment Independence Sustainability Unite Students | Applicant Index Report 10
Introducing the Themes The Finance theme brings Social theme measures Community theme Wellbeing theme Resilience theme draws The The The The together self-rated financial the strength of existing social measures the level of draws on the ONS standard on previous academic research means with confidence in networks together with level motivation among applicants wellbeing questions combined on resilience including the budgeting skills to provide an of confidence about “fitting in” to be part of a community with levels of positive and concepts of ‘grit’ and ‘learned overall financial health check at university. A high score in while at university, and their negative feelings that we have optimism’. A high score in this on the whole cohort. A high this theme indicates a cohort desire to belong. A high score found in previous surveys theme shows a cohort able score indicates that applicants with high social confidence in this theme also indicates a to be indicative of overall to work effectively towards believe they have sufficient together with confidence cohort that wants to belong wellbeing. These scores are clear goals and recover from means and skills to meet their in the university - and to a diverse group of peers combined to gauge applicants’ setbacks. costs while at university, and accommodation provider and is prepared to contribute level of wellbeing and allow for a demographic breakdown where relevant - to provide to building that community. demographic breakdown to may reveal disadvantaged an inclusive environment. Changes in the theme indicate help identify vulnerable groups. subgroups within the cohort. a rise or fall in the community- A high score indicates a cohort orientation of each cohort. with high levels of wellbeing. The The The The Learning theme Employment theme Independence theme, Sustainability theme assesses academic confidence assesses the level of optimism introduced in 2023, measures combines the strength of and commitment to the chosen about finding a graduate how prepared the cohort is concern about climate change course. A high score in this job together with self-rated to live independently, take with behaviours and personal theme indicates a cohort that level of work-related skills decisions for themselves and commitments to addressing feels academically prepared and experience. A high score access support when needed. environmental sustainability and confident about their indicates a cohort that is and climate change. A high learning. already feeling prepared score indicates a cohort who for the future job market is highly concerned about and confident about their climate change and is already prospects. taking action. Unite Students | Applicant Index Report 11
2 Thema琀椀c Analysis Unite Students | Applicant Index Report 12
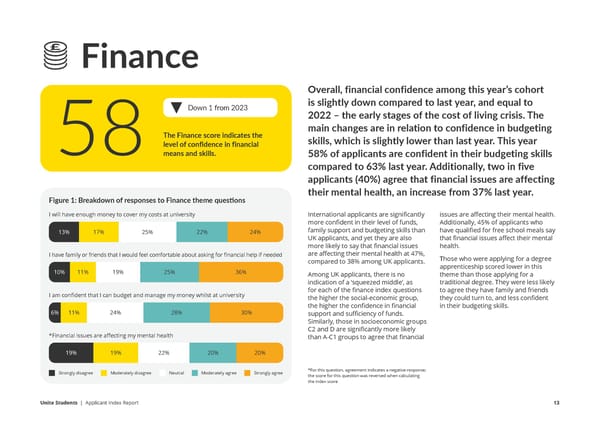
Finance Overall, financial confidence among this year’s cohort Down 1 from 2023 is slightly down compared to last year, and equal to 2022 – the early stages of the cost of living crisis. The The Finance score indicates the main changes are in relation to confidence in budgeting 58level of confidence in financial skills, which is slightly lower than last year. This year means and skills. 58% of applicants are confident in their budgeting skills compared to 63% last year. Additionally, two in five applicants (40%) agree that financial issues are affecting their mental health, an increase from 37% last year. Figure 1: Breakdown of responses to Finance theme ques琀椀ons I will have enough money to cover my costs at university International applicants are significantly issues are affecting their mental health. more confident in their level of funds, Additionally, 45% of applicants who 13% 17% 25% 22% 24% family support and budgeting skills than have qualified for free school meals say UK applicants, and yet they are also that financial issues affect their mental more likely to say that financial issues health. I have family or friends that I would feel comfortable about asking for financial help if needed are affecting their mental health at 47%, Those who were applying for a degree compared to 38% among UK applicants. apprenticeship scored lower in this 10% 11% 19% 25% 36% Among UK applicants, there is no theme than those applying for a indication of a ‘squeezed middle’, as traditional degree. They were less likely I am confident that I can budget and manage my money whilst at university for each of the finance index questions to agree they have family and friends the higher the social-economic group, they could turn to, and less confident the higher the confidence in financial in their budgeting skills. 6% 11% 24% 28% 30% support and sufficiency of funds. Similarly, those in socioeconomic groups C2 and D are significantly more likely *Financial issues are affecting my mental health than A-C1 groups to agree that financial 19% 19% 22% 20% 20% Strongly disagree Moderately disagree Neutral Moderately agree Strongly agree *For this question, agreement indicates a negative response; the score for this question was reversed when calculating the index score Unite Students | Applicant Index Report 13
Paid work Cost concerns Figure 2: When thinking about the cost of going to university, Slightly more applicants have undertaken The cost of living while at university is the which of the following is of greatest concern to you? paid work this year (70%) compared to greatest single financial concern among last year (68%). They worked a range of applicants (42%) though one in five are weekly hours with the most common concerned about all the costs associated being 10-19 hours per week (44%), with university. Female applicants are however 9% were working more than more concerned than male applicants 6% 40 hours. Age is the most significant when it comes to living costs, and 9% of driver of higher levels of paid work, with male applicants are not concerned about no real independent demographic effect. any of the costs compared with 5% of 20% The lower level of paid work seen among female applicants. LGBTQ+ applicants last year was not International applicants pay a higher 42% replicated, with LGBTQ+ applicants being tuition fee, so it is unsurprising to find just as likely to have carried out part time that they are more concerned about this work this year. cost (23%) and around a quarter (24%) Applicants who have worked are more are concerned about all areas of cost. 14% likely to think they will have enough However, compared to UK applicants money to cover their costs in higher they are less likely to have living costs education, though there is no effect on as their primary concern. 17% the other three questions within the There are no significant differences in the Finance theme. profile of cost concern by socioeconomic group, but those who have qualified for free school meals are more likely to be concerned about all costs. Cost of living while at university Cost of your tuition fees Cost of learning resources All of these None of these Unite Students | Applicant Index Report 14
Planning for living costs We asked applicants how they expect to cover the majority of their living Figure 3: How do you expect to cover the majority of costs while at university. A third intend your living costs while at university? to draw on maintenance loans or grants, and about a quarter (24%) plan to depend on family for the majority Maintenance loan or grant of their costs. The 17% who said they THEMATIC ANALYSIS FINANCE 33% would use income from employment mostly (though not entirely) intend to Family support live in their own or parents’ home. Female applicants are more likely to 24% anticipate relying on maintenance loans Income from employment whereas male applicants are more likely to anticipate drawing on family support 17% and scholarships. As might be expected, international applicants are much more Scholarship/studentship likely to use family financial support and 9% scholarships, though 9% still expect to draw on student loans or grants. This Bank loan or overdraft may indicate that they or their families are taking out loans in their home 7% country to support them to attend a UK university. Income from apprenticeship 6% Other / Don’t know 4% Unite Students | Applicant Index Report 15
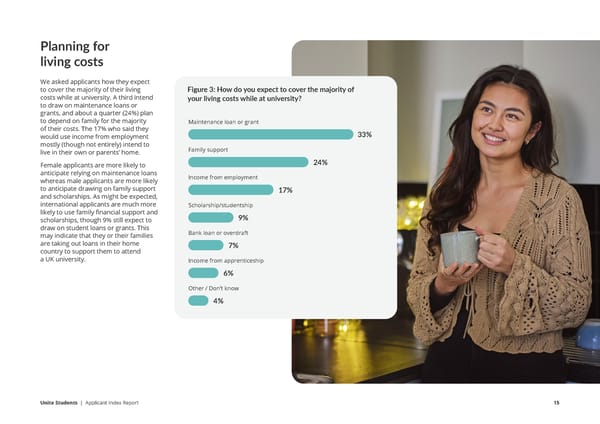
Figure 4: How do you expect to cover the majority of your living costs while at university – broken down by socioeconomic group* 60% 50% 52 47 40% 42 42 35 30% 28 25 20% 22 19 18 10% 11 13 0% A B C1 C2 D E Maintenance loan or grant Support from family Linear (Maintenance loan or grant) Linear (Support from family) There is a clear trend in planned use more consistent across these groups. of maintenance loans and grants This means that students from more versus family support between affluent backgrounds are more likely socioeconomic groups, whereas use to enter the workforce with lower debt, of scholarships and other methods are perpetuating wealth inequality. *For more information about socioeconomic groups, please refer to our notes on socioeconomic groups on page 9 and 43. Unite Students | Applicant Index Report 16
Accommodation choices Overall, 39% of applicants intend to live in university halls in their first year, with a further 9% intending to live in private purpose-built student accommodation. About a quarter (23%) intend to live at their parents’ home. Surprisingly, international applicants were less likely to intend to live in halls, and more likely to want to live in private rented housing or in a home that they own. This is possibly due to different cultural understandings of student accommodation options. Among UK applicants there are marked differences between socioeconomic groups. In groups AB, only 18% intend to live in their parents’ home. This increases incrementally by social grade, with 33% of groups DE intending to live at home. UCAS End of Cycle Data 2023 showed that 33% of all applicants intended to live at home, suggesting that the actual rate is more common in practice than the Applicant Index data suggests. Nonetheless, despite rising living costs (and 42% of applicants indicating living costs as their greatest cost concern) there does not yet seem to be a large scale move towards commuter student life. Impact of cost of living on university choice Applicants were asked to describe, in their own words, how the cost of living has affected their university choice, if at all. While the majority of responses were neutral, 22% shared negative themes related to costs associated with university. The location of the university was mentioned by one in five, and 17% mentioned that their choice of university would be affected. In terms of location, a common theme was making a choice constrained by financial considerations. This included choosing to live at home although, as mentioned above, rates of living at home do not seem to have increased. I know tuition fees are expensive and I’m not Neither me or my household members can My parents are divorced; the parent I live with sure how I’d pay for them so I chose universities afford for me to move out, so I had to only look is unemployed. I took a gap year to earn my close to my home or in my city to save on costs into universities that are in London that I can own money from employment, and have chosen such as accommodation. access through public transport. a university close to home so I do not have to cover accommodation costs. Unite Students | Applicant Index Report 17
Others talked about moving away to university but living closer to home so that travel back would be cheaper. Comments about choosing more budget-friendly cities – or sometimes cheaper locations within a city – were also common. A number of applicants were specifically avoiding London due to cost of living there, and some were purposely focusing their choices on towns and cities in the North of England. I chose more northern cities in hopes it Chosen universities that are closer would be a bit cheaper. I did not apply to to home to minimise transport costs. London universities even though one had a course I liked. Some wrote of their disappointment at not being able to apply to their preferred choice, and concerns about their future student experience. There was one university that I loved but The uni that is currently my first choice I can’t afford accommodation which I feel is definitely more on the expensive meant I had to go for a university closer side in terms of living and currently with to home rather than moving away. everything getting more expensive I may have to decide to choose a city which is definitely cheaper. As this is the first time we have asked this question of applicants, we don’t know how much this differs from the usual choice-making process that applicants experience, but it is an area that would benefit from further research. Unite Students | Applicant Index Report 18
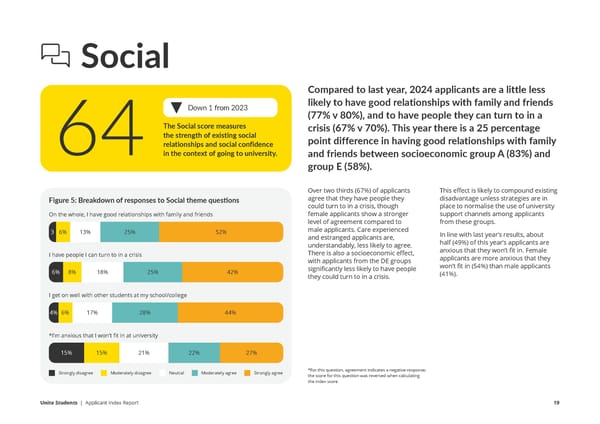
Social Compared to last year, 2024 applicants are a little less Down 1 from 2023 likely to have good relationships with family and friends (77% v 80%), and to have people they can turn to in a The Social score measures the strength of existing social crisis (67% v 70%). This year there is a 25 percentage 64relationships and social confidence point difference in having good relationships with family in the context of going to university. and friends between socioeconomic group A (83%) and group E (58%). Over two thirds (67%) of applicants This effect is likely to compound existing agree that they have people they disadvantage unless strategies are in Figure 5: Breakdown of responses to Social theme ques琀椀ons could turn to in a crisis, though place to normalise the use of university On the whole, I have good relationships with family and friends female applicants show a stronger support channels among applicants level of agreement compared to from these groups. 3 6% 13% 25% 52% male applicants. Care experienced In line with last year’s results, about and estranged applicants are, half (49%) of this year’s applicants are understandably, less likely to agree. anxious that they won’t fit in. Female I have people I can turn to in a crisis There is also a socioeconomic effect, applicants are more anxious that they with applicants from the DE groups won’t fit in (54%) than male applicants 6% 8% 18% 25% 42% significantly less likely to have people (41%). they could turn to in a crisis. I get on well with other students at my school/college 4% 6% 17% 28% 44% *I’m anxious that I won’t fit in at university 15% 15% 21% 22% 27% Strongly disagree Moderately disagree Neutral Moderately agree Strongly agree *For this question, agreement indicates a negative response; the score for this question was reversed when calculating the index score Unite Students | Applicant Index Report 19
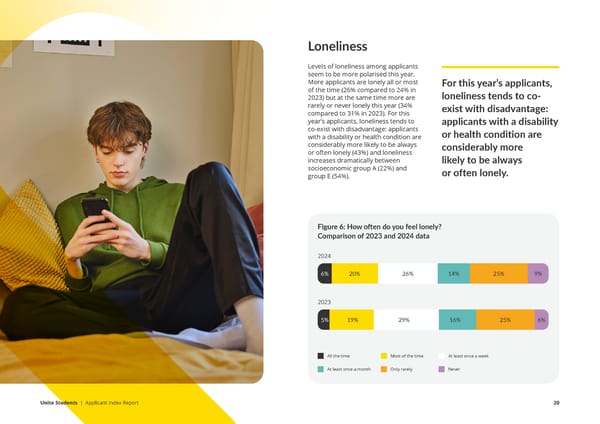
Loneliness Levels of loneliness among applicants seem to be more polarised this year. More applicants are lonely all or most For this year’s applicants, of the time (26% compared to 24% in loneliness tends to co- 2023) but at the same time more are rarely or never lonely this year (34% exist with disadvantage: compared to 31% in 2023). For this year’s applicants, loneliness tends to applicants with a disability co-exist with disadvantage: applicants or health condition are with a disability or health condition are considerably more likely to be always considerably more or often lonely (43%) and loneliness increases dramatically between likely to be always socioeconomic group A (22%) and or often lonely. group E (54%). Figure 6: How o昀琀en do you feel lonely? Comparison of 2023 and 2024 data 2024 6% 20% 26% 14% 25% 9% 2023 5% 19% 29% 16% 25% 6% All the time Most of the time At least once a week At least once a month Only rarely Never Unite Students | Applicant Index Report 20
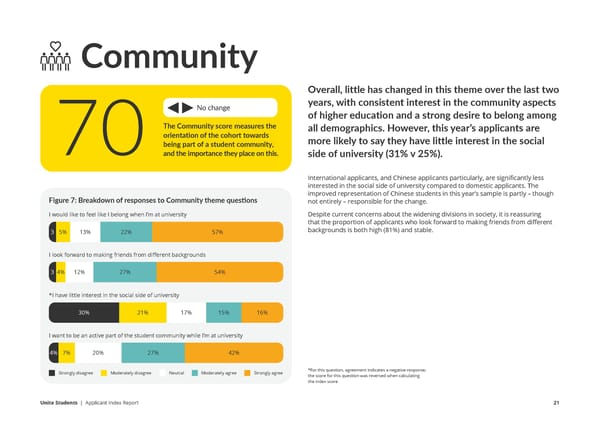
Community Overall, little has changed in this theme over the last two No change years, with consistent interest in the community aspects of higher education and a strong desire to belong among The Community score measures the all demographics. However, this year’s applicants are orientation of the cohort towards more likely to say they have little interest in the social 70being part of a student community, and the importance they place on this. side of university (31% v 25%). International applicants, and Chinese applicants particularly, are significantly less interested in the social side of university compared to domestic applicants. The improved representation of Chinese students in this year’s sample is partly – though Figure 7: Breakdown of responses to Community theme ques琀椀ons not entirely – responsible for the change. I would like to feel like I belong when I’m at university Despite current concerns about the widening divisions in society, it is reassuring that the proportion of applicants who look forward to making friends from different 3 5% 13% 22% 57% backgrounds is both high (81%) and stable. I look forward to making friends from different backgrounds 3 4% 12% 27% 54% *I have little interest in the social side of university 30% 21% 17% 15% 16% I want to be an active part of the student community while I’m at university 4% 7% 20% 27% 42% Strongly disagree Moderately disagree Neutral Moderately agree Strongly agree *For this question, agreement indicates a negative response; the score for this question was reversed when calculating the index score Unite Students | Applicant Index Report 21
Welcome and Belonging International applicants feel more assured qualified for free school meals expected to feel welcome There is also a strong socioeconomic effect here too, of their level of welcome and belonging when at a lower rate (60%) than those who did not (70%). with anticipated sense of belonging declining steadily they arrive at university compared to UK Similarly, disabled applicants are less confident of their from group A to E. And yet the vast majority (80%) of welcome. Almost a fifth (18%) of those with a physical applicants from all socioeconomic groups are equally applicants. But despite many years of widening or sensory disability did not expect to feel welcome keen to belong. participation efforts, working class applicants compared to 6% of applicants with no disability. Culture shock are much less confident of their welcome and When it comes to belonging, well over half (58%) International applicants are not alone in anticipating sense of belonging compared to their more of applicants expect to feel like they belong when a culture shock when they first arrive at university. affluent peers. they first go to university. Female applicants are less While 57% of international applicants agree that it confident about this at 52%, whereas two thirds of will be difficult to get used to the culture, 46% of UK Around two thirds (68%) of applicants think they will male applicants (67%) agree. An anticipated sense of applicants also agree. Care experienced applicants be welcome at university, and this rises to almost belonging is higher among international applicants are more likely even than international applicants to three quarters (73%) among international applicants. (69%) and, poignantly, among applicants who have anticipate a culture shock, at 63%. However, working class applicants are much less sure been in care (64%). However LGBTQ+ applicants, and of their welcome with a 20 percentage point difference those who are neurodivergent or have a mental health between socioeconomic groups A and E. Those who condition, are less likely to believe they will belong. Figure 8: Comparison of the percentage of applicants that agree they expect Working class applicants are much to feel welcome and a sense of belonging by socioeconomic group less confident of their welcome and 80% sense of belonging compared to 70% 73 72 their more affluent peers. 60% 68 67 63 62 62 50% 58 58 49 53 40% 44 30% 20% 10% 0% A B C1 C2 D E Socioeconomic group I expect that I will feel welcome I expect that I will feel like I belong Unite Students | Applicant Index Report 22
Wellbeing The scores for this theme are the same as last year, No change sustaining the improvement between 2022 and 2023. The Wellbeing score combines two However, there are higher levels For the first time, applicant wellbeing different sets of questions to take of shame among the applicant scores using the ONS standard a snapshot of the mental wellbeing population this year. Male and non- measures have returned approximately 63of the cohort. binary applicants have higher levels to pre-pandemic levels, as shown of shame than female applicants. in Figure 10. Scores in each of the LGBTQ+ applicants are more likely questions have increased meaningfully, to feel ashamed, as are care leavers. beyond the margin of error. However, Additionally, more than half of this encouraging finding has been applicants who are ethnically Chinese strongly affected by the increasing (58%) feel ashamed – the overwhelming proportion of international applicants in Figure 9: Breakdown of responses to Wellbeing theme ques琀椀ons majority of these are international the sample over recent years, reflecting I feel loved students from China. their growth within the student The Office for National Statistics (ONS) population. International applicants 5% 7% 17% 25% 45% Standard Wellbeing Measures use a score more positively on each of the 0-10 scale to assess the level of self- four indicators, and when comparing reported life satisfaction, feeling that life results for UK applicants the scores are *I feel ashamed is worthwhile, happiness and anxiety still somewhat lower than they were five across the population. Results are years ago - see Figure 11. 29% 21% 19% 16% 15% reported in terms of the percentage of the population that reports the highest levels (score of 9 or 10) in the first three *I feel rejected by others questions, and the lowest levels (0 or 1) of anxiety. 25% 20% 20% 18% 17% I feel capable of making decisions 4% 7% 16% 29% 44% Strongly disagree Moderately disagree Neutral Moderately agree Strongly agree *For this question, agreement indicates a negative response; the score for this question was reversed when calculating the index score Unite Students | Applicant Index Report 23
Figure 10: Responses to ONS Standard Wellbeing Measures for higher Figure 11: Responses to ONS Standard Wellbeing Measures for higher educa琀椀on applicants 2019-2024 educa琀椀on applicants 2019-2024 – UK domiciled applicants only Results are reported in terms of the percentage of the population that reports the highest levels (score of 9 or 10) in the first three questions, and the lowest levels (0 or 1) of anxiety. 30 30 25 25 25 24 20 21 21 21 22 22 20 21 20 20 18 18 17 17 18 17 18 15 15 16 15 16 16 15 16 13 14 10 10 10 10 11 5 5 0 Life satisfaction Life worthwhile Happiness Low anxiety 0 Life satisfaction Life worthwhile Happiness Low anxiety 2019 2021 2022 2023 2024 2019 2024 Base = UK domiciled applicants 2024 data = 1724; 2019 = 2002 Unite Students | Applicant Index Report 24
Disabilities and health conditions Rates of disability and health conditions rose sharply impairments. Improved awareness and diagnosis may among the applicant population between 2017 and 2021. be driving the higher incidence of ADHD, but the rise in They have remained largely stable over the last three physical and sensory impairments within the applicant years, but there are rises in the proportion of applicants population may be linked to improved support for with ADHD, physical or mobility impairments and sensory disabled students in schools, colleges and universities. Figure 12: Incidence of self-reported disability among the applicant popula琀椀on 2017-2024 20% 15% 10% 5% 0% Mental health ADD/ADHD* Au琀椀sm spectrum Specific learning A long standing Physical impairment Sensory Prefer not to say condi琀椀on condi琀椀on difficul琀椀es illness or health or mobility issues impairment condi琀椀on 2017 2019 2021 2022 2023 2024 Base = UK domiciled applicants 2024 data = 1724; 2019 = 2002 *Prior to 2022, ADD/ADHD was included in the Speci昀椀c learning di昀케culties category Unite Students | Applicant Index Report 25
Applicants with a disability were asked how they thought it would affect their life at university. Over a third (37%) will need additional support or adjustments for Figure 14: Which, if any, of the following best describe any mental health assessment, equating to 13% of the applicant population. issues you have experienced in the last two years. Comparison of 2023 and 2024 data 0% 5% 10% 15% 20% 25% 30% 35% 40% 45% Figure 13: How, if at all, do you think your disability or condi琀椀on will a昀昀ect your life at university? Anxiety 37% 38% 0% 5% 10% 15% 20% 25% 30% 35% 40% 24% Depression 23% I will need addi琀椀onal support or 37% adjustments for assessments 12% Ea琀椀ng disorder 10% 7% I will need addi琀椀onal support or 29% Obsessive compulsive disorder (OCD) adjustments for learning 6% 5% Post-trauma琀椀c stress disorder (PTSD) I will need addi琀椀onal support or 28% 5% adjustments for day to day life 5% Personality disorder 2 I do not think it will affect 23% 3% my life at university Bipolar 2 2 Schizophrenia / psychosis Other / don’t know 10% 2 1 Other 1 Base = 798 (applicants with a disability or health condition) 38% I have not experienced any of these issues 40% Mental health 2023 2024 Separately from the disability questions, all applicants were asked about their experience of mental health issues over the last two years. As was the case last year, The pattern of mental health issues experienced is similar to last year, with over a there are more applicants who consider themselves to have experienced one or third (37%) experiencing anxiety and about quarter (24%) experiencing depression. more mental health condition over the last two years than those who consider The prevalence of personality disorders within the cohort has more than doubled they have a mental health condition in the context of a question about disability. from 2023 to 2024, rising to 5%. The rate of eating disorders (12%) has also increased this year and is more common among female applicants and those who are LGB+. Neurodivergent applicants are more likely to experience a mental health issue than average, with only 11% reporting they have not experienced any mental health issues. Anxiety and depression are particularly elevated within this population, but there are also higher rates of eating disorder and OCD. Unite Students | Applicant Index Report 26
Resilience This year’s applicants are slightly less confident in their Down 1 from 2023 self-efficacy skills compared to last year. They are less likely to agree that they always meet deadlines (67% v The Resilience score measures the ability of applicants to plan and 71% in 2023). They are also less persistent in the face 65work effectively towards goals and of failure – this year 34% agree that if they do badly at to bounce back after a setback. something they don’t like to try again, compared to 32% in 2023. International applicants – and especially those from China – score themselves significantly higher in each of these areas except the fourth: they are less likely Figure 15: Breakdown of responses to Resilience theme ques琀椀ons to try again after failure. I am willing to take on short term discomfort for long term gain Lower scores in the first three areas are seen among applicants who may be 4% 6% 17% 29% 44% marginalised: those who are LGBTQ+, and those with disabilities and health conditions. Care experienced applicants are less likely to take on discomfort for long term gain, or to have a clear idea of their goals. I have a clear idea of my goals There are few differences between socioeconomic groups, but applicants from group A are significantly clearer about their goals. 6% 9% 17% 26% 42% I always meet deadlines 7% 9% 17% 26% 41% *If I do badly at something, I don’t like to try again 24% 20% 21% 17% 18% Strongly disagree Moderately disagree Neutral Moderately agree Strongly agree *For this question, agreement indicates a negative response; the score for this question was reversed when calculating the index score Unite Students | Applicant Index Report 27
Learning This theme has seen the largest change in score since Down 3 from 2023 last year, with a three-point drop overall compared to 2023. This change is driven by more negative responses The Learning score measures overall in each of the four questions. academic confidence among the cohort, combined with the level 69of comfort with course choice. This year, 43% of applicants – and While most applicants are confident almost half of male applicants (47%) they can learn the knowledge and – think they will struggle to keep up skills needed for their course, White with other students compared with applicants (86%) are more confident 35% in 2023. Although the last three than Asian (78%) and Black (76%) cohorts were directly affected by the applicants, which has relevance to the pandemic there seems to have been a BAME awarding gap. There is also a Figure 16: Breakdown of responses to Learning theme ques琀椀ons stronger impact on academic confidence lower level of confidence among care My chosen course is a good fit for me among this year’s cohort. Over half of experienced (70%) and estranged international applicants (55%) think they applicants (66%). For this question 3 4% 12% 26% 55% will struggle to keep up with others on there is a steady decline in confidence their course, rising to 62% of applicants between socioeconomic groups A who are ethnically Chinese, of which the (85%) and E (68%) – a pattern that is *I think I will struggle to keep up with other students on my course vast majority are international students not replicated in other questions within from China. Care leavers are also more this theme. 16% 18% 23% 21% 22% likely to think that they will struggle to keep up with others (61%) but levels are no higher than the average among I am sure I will complete my course estranged applicants. Most applicants are confident that they 2 4% 11% 22% 60% will complete their course, but Asian and Asian British applicants are slightly less confident. LGBTQ+ and care experienced I’m confident I can learn the knowledge and skills needed for my course and estranged applicants are also less confident about completing their course, 2 5% 11% 27% 55% as are applicants with a disability. Strongly disagree Moderately disagree Neutral Moderately agree Strongly agree *For this question, agreement indicates a negative response; the score for this question was reversed when calculating the index score Unite Students | Applicant Index Report 28
The impact of the Covid pandemic Those leaving school this year had the first part of their GCSE years, or equivalent, disrupted by the Covid pandemic. This year we offered participants the opportunity to talk about the impact of the pandemic in their own words in a free-text box, responding to the question “How has the Covid-19 pandemic affected your life since 2020, if at all?” Most participants chose to answer this question and a common theme arising from these comments was loss. Applicants felt a sense of loss in several different areas – learning, social opportunities, trips and work experience – and a sense of lost time. Put a pause on my learning, I felt robbed Felt like I missed out on a lot of my of two years of growth and development. teenage years, time kind of stopped and now all of a sudden I’m supposed to be going to uni. In addition to missing out on sections of the curriculum, and their experience of poor-quality learning during lockdowns, a sizeable number said they were struggling with motivation, concentration and study skills in the aftermath of the pandemic. Affected me a lot haven’t been able I feel that I was not able to gain exam to concentrate academically since the skills and various other school skills during pandemic. my GCSE exams which then reflected and transferred to my A-Levels. Unite Students | Applicant Index Report 29
The impact of the Covid pandemic A few wrote about taking an additional year or more In some cases, this has affected their confidence in However the pandemic was not a negative experience to complete their A-levels or equivalent, or mentioned relation to university. for all. Some were neutral about it and few experienced taking time out of education altogether. a period of calm and self discovery. Mental health impacts were also mentioned frequently, especially anxiety. A common theme was the loss of social opportunities, leading in some cases to ongoing social anxiety and isolation. Words such as “lonely”, “shy” and “introverted” were used to self-describe the I think I became more anxious and found way they have felt since the pandemic. public speaking more difficult afterwards. I’ve become more religious and I used that I became less social too so I’m a bit scared time to get to know myself, my roots & my for uni. values which helped me to figure out what I wanted from life and where I want to go. It The prevalence of these comments suggests that this definitely helped me mentally as well because I think it made me more shy and less cohort may find it particularly challenging to make I got a break from the pressure of school. comfortable around many people because social connections when they first go to university. I didn’t have contact with other people for Although they are not the first cohort to have their Sadly, comments like these were very infrequent. a long time. social development interrupted, previous cohorts were older and had more established social skills when the lockdowns began. Additionally some struggled with health anxieties, including OCD, both during and after the pandemic. Others had experienced temporary or ongoing ill health directly relating to Covid, or had lost loved I now prefer to work and study at home rather ones in the pandemic. than outside. Not as social/few social skills so more anxious about socialising. Unite Students | Applicant Index Report 30
School absence School absence due to mental health* has increased Almost two thirds (64%) of LGB+ applicants and 81% Among those who had been absent, 43% thought they sharply this year and may lead to higher levels of of trans/non-binary applicants had missed education would need to miss teaching time at university due absence from formal learning at university. due to their mental health. Rates are also significantly to their mental health, equating to 15% of the total Over a third (36%) of this year’s applicants have missed higher among care experienced and estranged applicant population. Rates were significantly higher school or college over the last two years due to their applicants, those from the lowest socioeconomic group among care leavers and those with a disability or mental health; a significant increase from 30% last and those who had qualified for free school meals, mental health condition. year. The figure rises to 39% among UK domiciled risking a perpetuation of disadvantage. applicants. Given the qualitative feedback outlined in The duration of absence due to mental health is very the previous section, this finding is disappointing but similar to last year, with a quarter being absent for not surprising. The sharp increase in school absence 20 or more days. This equates to 9% of all applicants compared to last year lends support to the theory that having missed more than four weeks of learning, and social anxiety is particularly acute in this cohort. 12% of female applicants. Additionally, around one Over one in four (42%) female applicants have missed in five (19%) of all LGB+ applicants have missed more education due to mental health compared to 27% of than four weeks’ learning. The data also suggests male applicants. Female applicants were also more that care experienced and estranged applicants, and likely to have experienced longer absences. Other working class applicants, will also have significantly groups affected are those dealing with neurodivergent higher rates of long term absence due to mental conditions, of which 65% said they have missed school health, but sample sizes are too small to generate *Questions in this section were only asked of respondents who had been in (up from 49% in 2023). a reliable figure. education in the last two years (base=2132) Unite Students | Applicant Index Report 31
Employment The employment theme score has increased by two Up 2 from 2023 points this year, partly due to increased confidence, The Employment score measures however there are demographic differences across applicants’ confidence in their these scores. graduate employment prospects 64together with their employability This year, 40% strongly agree that they When it comes to getting the job they skills and experience. are confident about getting the job they want after graduation, those who have want, compared with 34% last year. This done paid work have a similar level of may be driven by better opportunities confidence than those who have not, for work experience among this cohort. even though they agree more strongly This year’s applicants have higher levels with the other three statements in this of perceived work experience (52% v theme. Figure 17: Breakdown of responses to Employment theme ques琀椀ons 47% in 2023) and are slightly more likely I am confident about getting the job I want after graduation to have taken on paid work (70% v 68%). Against each of the statements, male applicants scored themselves higher 7% 10% 21% 23% 40% International applicants score notably than female applicants did. higher across all questions than UK applicants. Among UK applicants, those I have skills and experience that employers want from AB socioeconomic groups are the most confident in their job prospects. 6% 8% 20% 26% 39% I already have a lot of work experience 14% 14% 19% 21% 31% I have taken part in activities to develop my skills for employment 6% 10% 18% 27% 39% Strongly disagree Moderately disagree Neutral Moderately agree Strongly agree Unite Students | Applicant Index Report 32
Independence This year, confidence is slightly up across all statements Up 1 from 2023 in this theme, with male applicants and international applicants being particularly confident. For example, The Independence score measures confidence in self-efficacy skills three quarters (75%) of male applicants are confident 69relevant to starting university, about living independently at university compared to including ability to access support. under two thirds (63%) of female applicants. Applicants with a disability, mental health condition or who are neurodivergent, and LGBTQ+ applicants, are less confident than their peers in each of these areas. Figure 18: Breakdown of responses to Independence theme ques琀椀ons I am confident about living independently at university 5% 9% 18% 24% 43% I know where to go to access external support (healthcare etc) if I need it 5% 9% 18% 26% 41% I feel confident about addressing issues related to my studies and living situation independently 4% 8% 21% 28% 39% I feel confident in making decisions for myself 4% 7% 16% 27% 46% Strongly disagree Moderately disagree Neutral Moderately agree Strongly agree Unite Students | Applicant Index Report 33
When it comes to specific practical life skills (cooking, laundry, cleaning), and helping a friend in distress, this year’s cohort are less confident than last year’s. Figure 20: Thinking about your educa琀椀on of the past two years, which of the following opportuni琀椀es would you have liked? 0% 10% 20% 30% 40% 50% 60% Figure 19: Percentage of applicants that agree they are con昀椀dent about key life skills, comparison between 2024 and 2023 The opportunity to learn more life skills 51% 100% 90% The opportunity to do 88 more projects on topics 42% 80% 84 82 82 that interest you 79 80 77 79 70% The opportunity to do more volunteering or 41% 60% 64 63 work experience 50% The opportunity to take part in more ac琀椀vi琀椀es 34% 40% such as art, music or sport 30% The opportunity to study more subjects 29% 20% 10% 0% About half (51%) of applicants would have liked to learn more life skills as part of their Cooking a meal Washing your Cleaning your Managing a Helping a friend education over the past two years. There was also support for an enriched curriculum laundry living space conflict with in distress with more projects, work experience, arts and sport. There was, however, limited housemates support for learning a broader range of academic subjects. 2023 2024 When asked how they have learned their skills, half of all applicants learned practical skills from their parents (female applicants significantly more than male). However, when it comes to the relationship skills (managing conflict, helping a friend in distress) only 22% have learned these from parents. Almost a third (29%) are self-taught and 20% have learned from friends. A minority (7%) have learned these skills from social media, rising to 9% among male applicants. Unite Students | Applicant Index Report 34
Sustainability Commitment to sustainability has increased this year, Up 1 from 2023 largely driven by more applicants making sacrifices to live more sustainably (53% compared to 48% in 2023). The Sustainability score measures the strength of feeling about climate change together with personal Male applicants (58%) and applicants over 21 (64%) are more likely to agree with 68commitment to living sustainably. this statement, as are international applicants (70%). Apart from these differences, applicants from different backgrounds are united in their largely positive attitude towards sustainability. Figure 21: Breakdown of responses to Sustainability theme ques琀椀ons I recycle 5% 7% 13% 24% 51% I have made sacrifices so that I can live more sustainably 8% 14% 24% 23% 30% I am careful about my use of water and electricity 6% 10% 20% 26% 38% It is extremely important to address climate change 4% 6% 17% 26% 48% Strongly disagree Moderately disagree Neutral Moderately agree Strongly agree Unite Students | Applicant Index Report 35
3 Topical issues Unite Students | Applicant Index Report 36
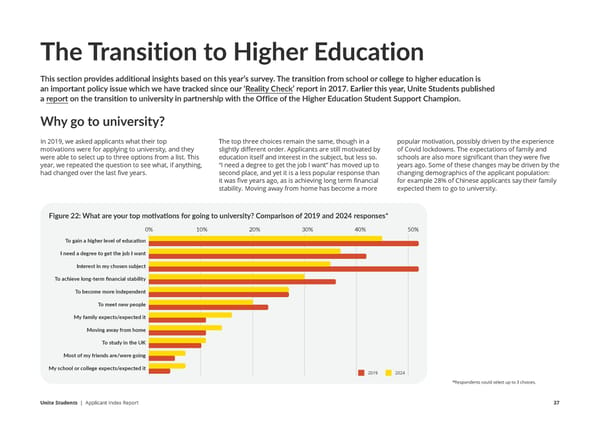
The Transition to Higher Education This section provides additional insights based on this year’s survey. The transition from school or college to higher education is an important policy issue which we have tracked since our ‘Reality Check’ report in 2017. Earlier this year, Unite Students published a report on the transition to university in partnership with the Office of the Higher Education Student Support Champion. Why go to university? In 2019, we asked applicants what their top The top three choices remain the same, though in a popular motivation, possibly driven by the experience motivations were for applying to university, and they slightly different order. Applicants are still motivated by of Covid lockdowns. The expectations of family and were able to select up to three options from a list. This education itself and interest in the subject, but less so. schools are also more significant than they were five year, we repeated the question to see what, if anything, “I need a degree to get the job I want” has moved up to years ago. Some of these changes may be driven by the had changed over the last five years. second place, and yet it is a less popular response than changing demographics of the applicant population: it was five years ago, as is achieving long term financial for example 28% of Chinese applicants say their family stability. Moving away from home has become a more expected them to go to university. Figure 22: What are your top mo琀椀va琀椀ons for going to university? Comparison of 2019 and 2024 responses* 0% 10% 20% 30% 40% 50% To gain a higher level of educa琀椀on I need a degree to get the job I want Interest in my chosen subject To achieve long-term financial stability To become more independent To meet new people My family expects/expected it Moving away from home To study in the UK Most of my friends are/were going My school or college expects/expected it 2019 2024 *Respondents could select up to 3 choices. Unite Students | Applicant Index Report 37
Alternatives to university We asked applicants to traditional university courses whether they had seriously considered other options when applying to university. Just over a quarter (28%) have not considered other alternatives; 36% had considered a degree apprenticeship and a quarter considered a full-time job. Those planning to live at home are significantly more likely to consider a degree apprenticeship than those planning to move away. Care leavers are more likely to consider taking a full-time job as an alternative. Figure 23: When applying for university did you seriously consider any of the following op琀椀ons as an alterna琀椀ve? 0% 5% 10% 15% 20% 25% 30% 35% 40% Degree appren琀椀ceship 36% Taking a full-琀椀me job 25% Other type of appren琀椀ceship 21% or work-related training Other type of full-琀椀me educa琀椀on 17% None of the above 28% Unite Students | Applicant Index Report 38
Withdrawing before enrolment About a third (32%) of applicants think it likely that they will not take up their place Respondents were able to choose multiple reasons from a list, including an ‘other’ at university, however the majority of these only think it ‘somewhat likely’. option. Financial issues are the most common reason closely followed by not achieving the required grades. However, lack of confidence, mental ill-health and homesickness were also significant. Figure 24: How likely is it that you will not go to university, for example because you withdraw your applica琀椀on or you don’t take up the place Figure 25: If you don’t go to university, what is most likely to be the reason? that is o昀昀ered? 35% 0% 10% 20% 30% 40% 50% 60% 70% 80% 90% 100% 30% 32 33% 32% 19% 9% 4 4 25% 27 20% 22 21 Not at all likely Not likely Somewhat likely Likely Very likely Don’t know 15% 15 13 10% 10 Broadly, these feelings are more prevalent among male applicants and those who are aged 19 or over. There is no significant difference between UK and international 5% applicants, though applicants who are ethnically Chinese (85% of which are 5 international students from China) are much less likely to think they won’t take 0% up their place, suggesting a higher level of uncertainty among other international Financial Not achieving Lack of Mental Homesickness Physical Stories about Other / student groups. These feelings are also more prevalent among care experienced and issues the grades confidence ill-health ill-health university don’t know estranged applicants, those with a disability, health condition or neurodivergence, you need in the media and LGB+ applicants. Base: Applicants who think it likely that they will not go to university (704) Data from the UCAS 2023 End of Cycle report shows that 26% of last year’s applicants were not placed, so we know not all applicants end up in higher education. Mental ill-health was the most significant concern for applicants with a disability or Nonetheless, it is impossible to infer how many of those who think they might drop mental health condition, neurodivergent applicants, estranged applicants and those out of the applicant process will indeed do so. The overall strength of feeling – only who are LGB+. ‘somewhat likely’ – suggests that, for many, these are concerns rather than strong doubts. Unite Students | Applicant Index Report 39
Data sharing Data sharing between schools/colleges and universities Sharing sexuality and gender identity data Over a quarter of applicants identified themselves as Lesbian, Gay, Bisexual, Trans, Over one in four (42%) applicants would give consent for their school/college to Queer, Pansexual, Asexual, or Non-Binary (27%). The proportion of this group share any data with their university, and 38% would give consent to share some willing to share this information with their university has increased from just over information. There were no significant differences in this figure between half in 2023 to two-thirds this year. This might reflect a greater confidence in higher demographic groups. education as an inclusive sector. Nonetheless, it still implies that some applicants Just over half of applicants (53%) assume that schools and colleges regularly share are choosing not to share this information, meaning data collected by UCAS safeguarding information with universities, with a similar proportion believing they underrepresents diversity within the cohort. share information about mental health conditions, disabilities and reasonable adjustments. While safeguarding data is rarely shared in practice, these assumptions Sharing disability data suggest that there is already a broad acceptance for data sharing between schools/ For those with disabilities (41% of the cohort), the proportion of those who have colleges and universities. already informed their university has dropped slightly since 2023, from 56% to 52%. The percentage of those who do not intend to share this information at all has risen slightly from 18% to 20%. Unite Students | Applicant Index Report 40
4 Methodology Unite Students | Applicant Index Report 41
Methodology Unless otherwise stated, all data in this report has been drawn from For the Wellbeing theme, we have also included the ONS wellbeing questions, which are measured on an 11 point scale. These questions represent 40% of the theme’s a survey administered via the Savanta Panel between 8-29 April 2024, overall score, with four 7-point scale items contributing the remaining 60%. with 2,190 respondents who were planning to start a full-time degree or A high index score is indicative of a positive response in relation to each of the degree apprenticeship course in the 2024-25 academic year. The sample themes, however it should be remembered that there are many valid reasons why an has been constructed and weighted to be broadly representative of the individual applicant may give a low score in one or more themes. They may not have applicant population as a whole. The margin of error is approximately had opportunities to develop key skills, or may have faced challenging circumstances. +/-2% to the 95% confidence interval and 3% to the 99% confidence A demographic breakdown of the scores highlights groups that may require targeted interval. support, and in some cases only a systemic change will produce equality of outcomes. Further questions have been included in the survey to address topical issues within the The sample was weighted and split by Gender and School Type (state or private). sector. These are discussed in relation to a relevant theme, or in a separate section. The following weighting matrix was used: The questions that form the index scores are items to which respondents indicate their level of agreement on a seven-point scale, from “strongly disagree” to “strongly Male - Fee paying school or college 4.8% agree”. For the purposes of discussion we have used the following interpretation when reporting the result: Male – State or other 39.4% 7-point scale: 0-1 Strongly disagree 2 Moderately disagree Female – Fee paying school or college 4.8% 3 Neutral 4 Moderately agree Female – State or other 51% 5-6 Strongly agree The sample does not include applicants to part-time courses. Elsewhere in the survey, there is a small number of questions that have been asked against a 5-point scale and which are interpreted as follows: The Applicant Index provides a cohort score out of 100 for each of nine different 1 Strongly disagree themes. The scores for eight of these themes are based on responses to 28 different 5-point scale: statements, four in each theme, on a 7-point scale of agreement. From this, an 2 Disagree average score from 0-6 is calculated for the whole population and sub-populations, 3 Neutral and each item is weighted equally within the theme score to provide a maximum score of 100 and a minimum of 0 for each theme. 4 Agree 5 Strongly agree Reported demographic differences in the data are significant to the 99% confidence level unless otherwise stated. Unite Students | Applicant Index Report 42
Definitions of socioeconomic groups Demographic data about socioeconomic status was collected via a question about the occupation of the chief income earner in the respondents’ parental household. Responses were as below and were subsequently grouped using the NRS Social Grade system. The percentage of applicants who fell in each category is shown below, compared to the most recent NRS population percentages dating back to 2016 - which have stayed consistent since the Ipsos 2008 frequency and are expected to be consistent in 2024. Frequency in Frequency in the Chief income earner’s occupation Social grade Applicant Index 2016 - NRS responses Professional / higher managerial (e.g. doctor, lawyer, chairperson or managing A 4% 18% director of medium or large firm) Manager / senior administrator (e.g. senior manager, owner of B 23% 26% small business, head teacher) Supervisor / clerical / skilled non- manual (e.g. teacher, secretary, C1 28% 21% junior manager, police constable) Skilled manual worker (e.g. firefighter, C2 20% 15% plumber, electrician, hairdresser) Semi-skilled / unskilled manual worker (e.g. assembler, postal worker, shop D 15% 10% assistant) Receiving state benefits for sickness, unemployment, old age or any E 10% 4% other reason Unite Students | Applicant Index Report 43